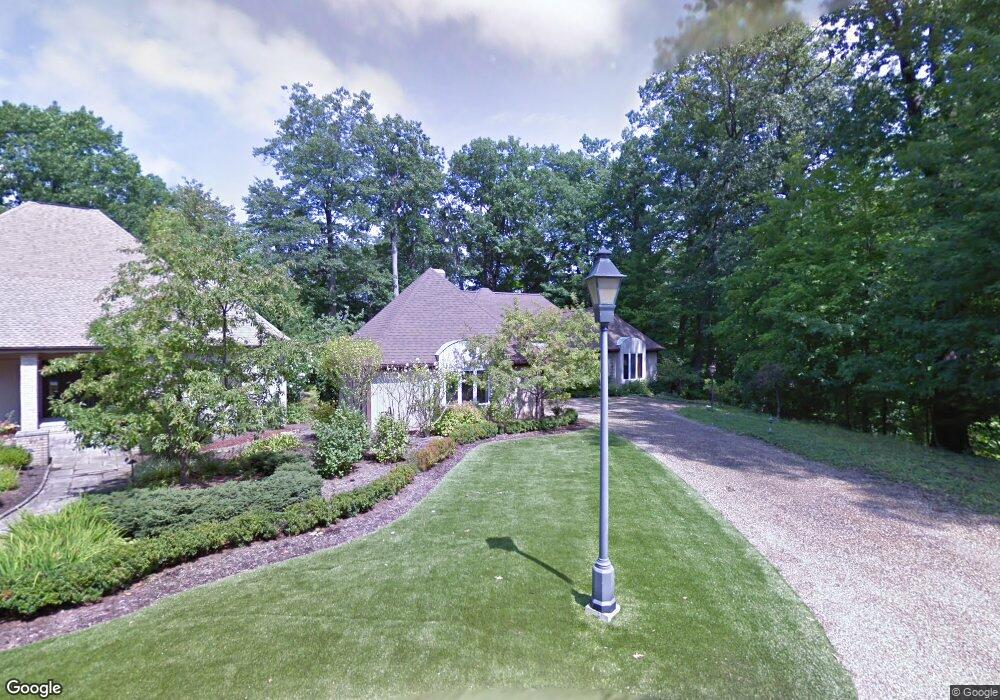
1820 Stonelake Dr Beachwood, OH 44122
Estimated Value: $596,000 - $678,017
4
Beds
5
Baths
2,948
Sq Ft
$221/Sq Ft
Est. Value
About This Home
This home is located at 1820 Stonelake Dr, Beachwood, OH 44122 and is currently estimated at $651,004, approximately $220 per square foot. 1820 Stonelake Dr is a home located in Cuyahoga County with nearby schools including Greenview Upper Elementary School, Sunview Elementary School, and Memorial Junior High School.
Ownership History
Date
Name
Owned For
Owner Type
Purchase Details
Closed on
May 1, 2025
Sold by
Abrams Louise Ellen and Fuerst Robert A
Bought by
Robert A Fuerst And Louise Ellen Abrams Revoc and Fuerst
Current Estimated Value
Purchase Details
Closed on
Mar 17, 2017
Sold by
Abrams Louise E and Fuerst Robert A
Bought by
Abrams Louise E
Purchase Details
Closed on
Jun 10, 2010
Sold by
Mccormack Nancy B
Bought by
Fuerst Robert A and Abrams Louise E
Home Financials for this Owner
Home Financials are based on the most recent Mortgage that was taken out on this home.
Original Mortgage
$328,500
Interest Rate
5.13%
Mortgage Type
Purchase Money Mortgage
Purchase Details
Closed on
Aug 12, 1999
Sold by
Mccormack Nancy B
Bought by
Mccormack Nancy B
Purchase Details
Closed on
Jan 1, 1984
Bought by
Mccormack Nancy B
Create a Home Valuation Report for This Property
The Home Valuation Report is an in-depth analysis detailing your home's value as well as a comparison with similar homes in the area
Home Values in the Area
Average Home Value in this Area
Purchase History
| Date | Buyer | Sale Price | Title Company |
|---|---|---|---|
| Robert A Fuerst And Louise Ellen Abrams Revoc | -- | None Listed On Document | |
| Abrams Louise E | -- | None Available | |
| Fuerst Robert A | $453,500 | Revere Title | |
| Mccormack Nancy B | -- | -- | |
| Mccormack Nancy B | -- | -- |
Source: Public Records
Mortgage History
| Date | Status | Borrower | Loan Amount |
|---|---|---|---|
| Previous Owner | Fuerst Robert A | $328,500 |
Source: Public Records
Tax History Compared to Growth
Tax History
| Year | Tax Paid | Tax Assessment Tax Assessment Total Assessment is a certain percentage of the fair market value that is determined by local assessors to be the total taxable value of land and additions on the property. | Land | Improvement |
|---|---|---|---|---|
| 2024 | $12,058 | $178,885 | $86,415 | $92,470 |
| 2023 | $14,772 | $177,110 | $29,300 | $147,810 |
| 2022 | $14,683 | $177,100 | $29,295 | $147,805 |
| 2021 | $14,553 | $177,100 | $29,300 | $147,810 |
| 2020 | $15,088 | $161,000 | $26,640 | $134,370 |
| 2019 | $13,577 | $460,000 | $76,100 | $383,900 |
| 2018 | $13,914 | $161,000 | $26,640 | $134,370 |
| 2017 | $14,422 | $157,960 | $45,500 | $112,460 |
| 2016 | $14,328 | $157,960 | $45,500 | $112,460 |
| 2015 | $13,294 | $157,960 | $45,500 | $112,460 |
| 2014 | $13,294 | $147,640 | $42,530 | $105,110 |
Source: Public Records
Map
Nearby Homes
- 23614 Cedar Rd
- 4586 Greenwold Rd
- 23903 E Baintree Rd
- 2172 Lyndway Rd
- 4532 Mackall Rd
- 23710 E Baintree Rd
- 24107 E Silsby Rd
- 1854 Oakmount Rd
- 2015 S Green Rd
- 1827 Maywood Rd
- 1834 Maywood Rd
- 4521 Golfway Rd
- 23105 E Groveland Rd
- 4485 Golfway Rd
- 5150 Three Village Dr Unit TL-G
- 23100 E Groveland Rd
- 2060 Langerdale Rd
- 4446 Baintree Rd
- 0 River Trail
- 1895 Temblethurst Rd
- 1800 Stonelake Dr
- 1841 Ridgebrook Cir
- 1849 Ridgebrook Cir
- 1833 Ridgebrook Cir
- 1857 Ridgebrook Cir
- 1860 Stonelake Dr
- 1801 Ridgebrook Cir
- 1825 Ridgebrook Cir
- 0 Woodbrook
- 2023 Lyndway Rd
- 1817 Ridgebrook Cir
- 1809 Ridgebrook Cir
- 1882 Woodbrook Ln Unit 1
- 2027 Lyndway Rd
- 1890 Woodbrook Ln Unit 2
- 1900 Stonelake Dr
- 2065 Lyndway Rd
- 1898 Woodbrook Ln
- 2021 Lyndway Rd
- 24149 Cedar Rd