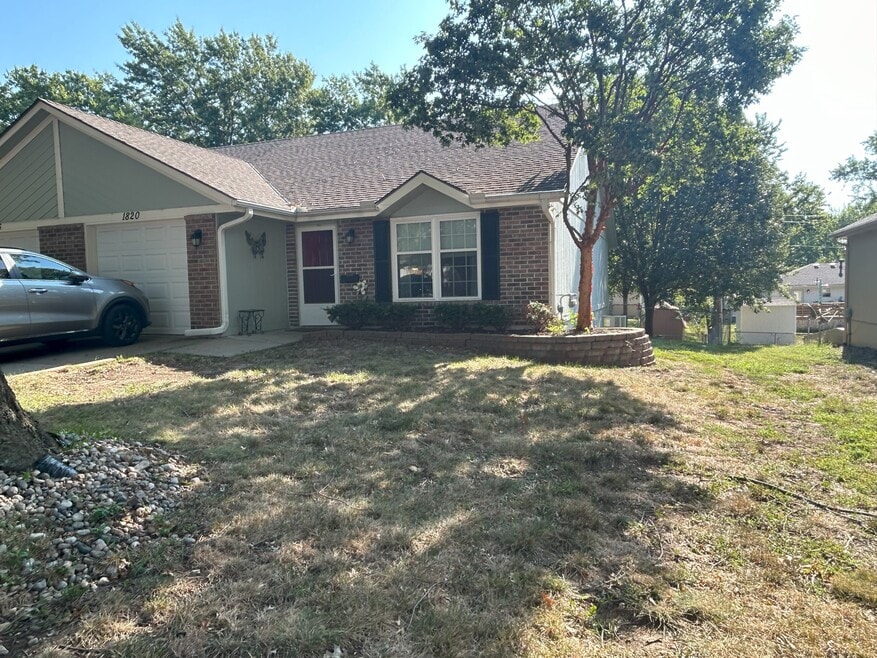

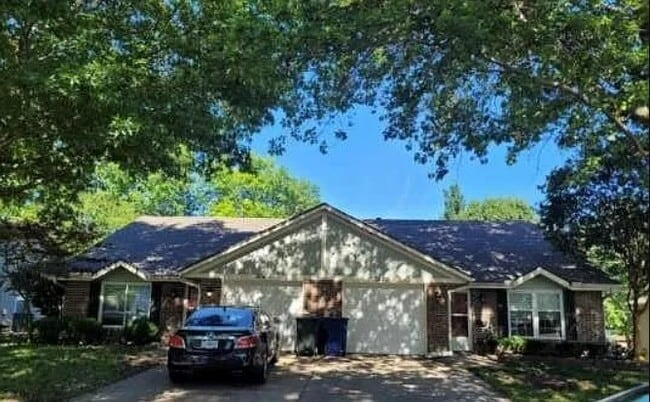
1820 SW 6th St Blue Springs, MO 64014
2
Beds
1.5
Baths
1,110
Sq Ft
4,574
Sq Ft Lot
About This Home
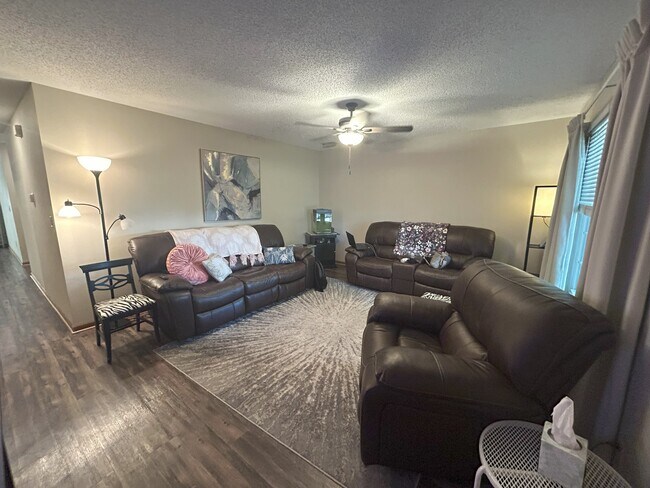
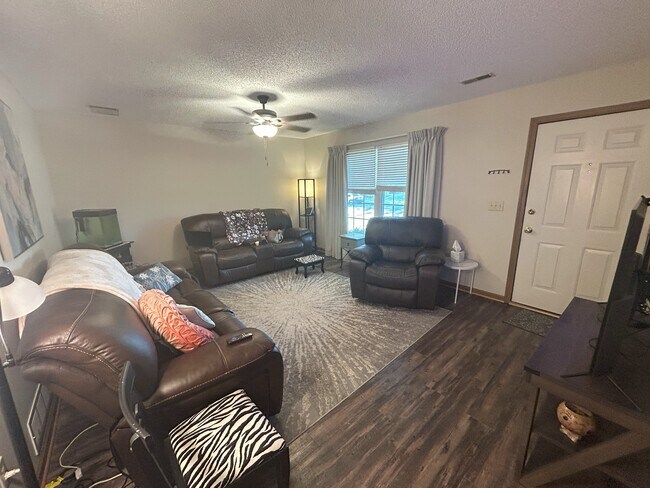
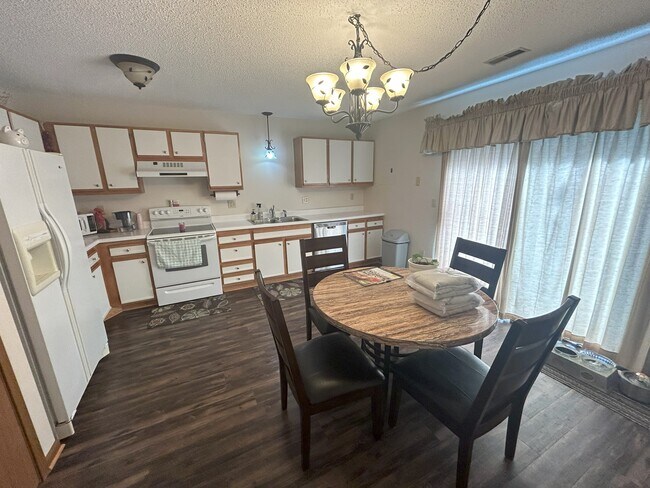
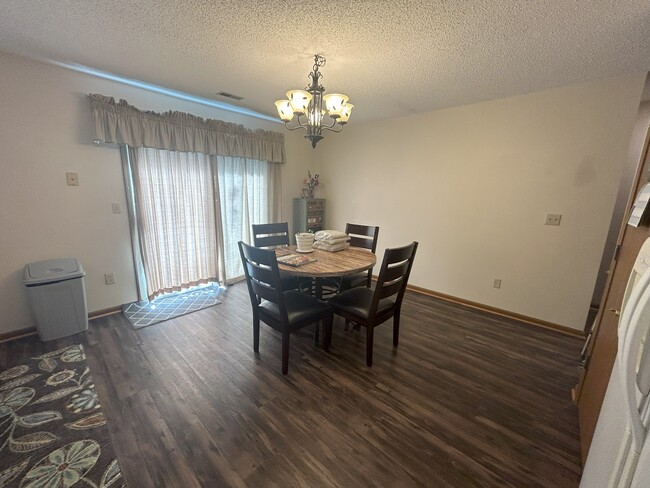
Fantastic 2 bedroom 1.5 bath duplex located in the heart of Blue Springs! This home has beautiful LVT flooring throughout the living room and kitchen. The kitchen has newer appliances and a large dinning area that walks out to the big back deck and yard. One car garage. Mowing is included in the rent! Contact us for more information and application process!
Listing Provided By

Map
Nearby Homes
- 4805 SW 6th St
- 4809 SW 6th St
- 2115 S 7 Hwy
- 1820 SW Keystone Dr
- 2401 SW 2nd Street Terrace
- 1628 SE 1st Street Terrace
- 1616 SE 1st Street Terrace
- 109 SE Castlerock Dr
- 2505 SW Richwood Cir
- 1917 SE Abbey St
- 1104 SW Mic-O-say Dr
- 1705 SE Abbey St
- 1103 SW Stonecreek Dr
- 1004 SW Twilight Ln
- 1201 SW Hopi St
- 309 SE Shamrock Ln
- 2603 SW Shadow Creek Ct
- 1305 S Ward Pkwy
- 309 SE Shawn Ct
- 2601 SE 5th Street Ct
- 404 SW Keystone Ct
- 309 SW Richwood Ln
- 409 SW Westminister Rd
- 915 SW Hampton Ct
- 901 SW Clark Rd
- 1008 SW Pinto Ln
- 1200 S Mo-7 Hwy
- 109 SE Rockwood St
- 2808 SE 2nd St
- 101 SW Victor Dr
- 708 SE Shamrock Ln
- 305 SE Westminister Rd
- 3016 SE 3rd St
- 414 SW Moreland School Rd
- 900 SE Tequesta Ln
- 1301 SW 20 St
- 1333 SW 21st St
- 702 SW 15th St
- 326 SW 6th St Unit 326
- 156 SW 8th St