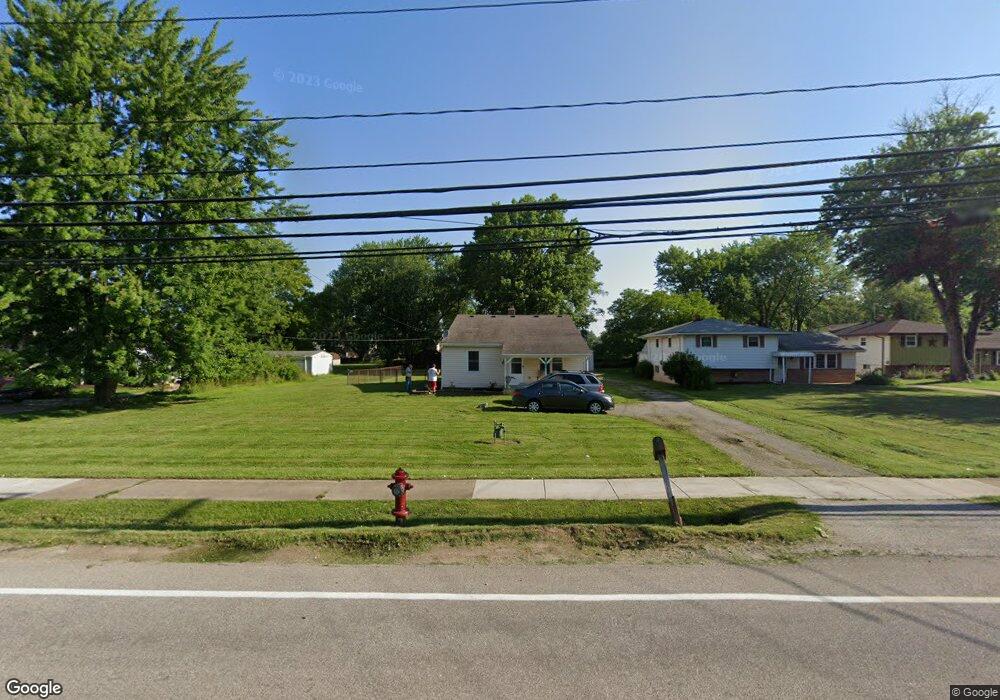
18200 Sheldon Rd Brookpark, OH 44142
Estimated Value: $193,035 - $232,000
3
Beds
2
Baths
1,235
Sq Ft
$167/Sq Ft
Est. Value
About This Home
This home is located at 18200 Sheldon Rd, Brookpark, OH 44142 and is currently estimated at $206,009, approximately $166 per square foot. 18200 Sheldon Rd is a home located in Cuyahoga County with nearby schools including Berea-Midpark Middle School, Berea-Midpark High School, and The Academy of St. Bartholomew.
Ownership History
Date
Name
Owned For
Owner Type
Purchase Details
Closed on
Feb 8, 2022
Sold by
Holcomb Lashonda R
Bought by
Holcomb Hoidingsohio Llc
Current Estimated Value
Purchase Details
Closed on
Jun 19, 1998
Sold by
Parker Yoshiko Mori and Parker Yoshiko M
Bought by
Ratliff Lashonda S
Home Financials for this Owner
Home Financials are based on the most recent Mortgage that was taken out on this home.
Original Mortgage
$109,000
Interest Rate
7.27%
Purchase Details
Closed on
Nov 20, 1991
Bought by
Parker Robert T
Purchase Details
Closed on
Jun 24, 1991
Sold by
Russell Darrell A
Bought by
Sec Of H U D
Purchase Details
Closed on
Jul 22, 1988
Sold by
Fisher Dennsi C
Bought by
Russell Darrell A
Purchase Details
Closed on
Aug 17, 1976
Sold by
Strejcek Ronald F and Strejcek Charlyn
Bought by
Fisher Dennsi C
Purchase Details
Closed on
Jan 1, 1975
Bought by
Strejcek Ronald F and Strejcek Charlyn
Create a Home Valuation Report for This Property
The Home Valuation Report is an in-depth analysis detailing your home's value as well as a comparison with similar homes in the area
Home Values in the Area
Average Home Value in this Area
Purchase History
| Date | Buyer | Sale Price | Title Company |
|---|---|---|---|
| Holcomb Hoidingsohio Llc | -- | Titleco Title Agency | |
| Ratliff Lashonda S | $111,000 | Real Estate Title | |
| Parker Robert T | -- | -- | |
| Sec Of H U D | -- | -- | |
| Russell Darrell A | $70,000 | -- | |
| Fisher Dennsi C | $27,500 | -- | |
| Strejcek Ronald F | -- | -- |
Source: Public Records
Mortgage History
| Date | Status | Borrower | Loan Amount |
|---|---|---|---|
| Previous Owner | Ratliff Lashonda S | $109,000 |
Source: Public Records
Tax History
| Year | Tax Paid | Tax Assessment Tax Assessment Total Assessment is a certain percentage of the fair market value that is determined by local assessors to be the total taxable value of land and additions on the property. | Land | Improvement |
|---|---|---|---|---|
| 2024 | $2,626 | $50,925 | $14,630 | $36,295 |
| 2023 | $3,117 | $50,060 | $14,110 | $35,950 |
| 2022 | $3,095 | $50,050 | $14,110 | $35,950 |
| 2021 | $3,079 | $50,050 | $14,110 | $35,950 |
| 2020 | $2,777 | $39,730 | $11,200 | $28,530 |
| 2019 | $2,696 | $113,500 | $32,000 | $81,500 |
| 2018 | $2,685 | $39,730 | $11,200 | $28,530 |
| 2017 | $2,628 | $35,910 | $9,660 | $26,250 |
| 2016 | $2,607 | $35,910 | $9,660 | $26,250 |
| 2015 | $3,921 | $35,910 | $9,660 | $26,250 |
| 2014 | $3,921 | $37,810 | $10,190 | $27,620 |
Source: Public Records
Map
Nearby Homes
- 6490 Grosse Dr
- 6728 Benedict Dr
- 6213 Siegler Dr
- 6210 Siegler Dr
- 6748 Benedict Dr
- 6752 Benedict Dr
- 6744 Benedict Dr
- 6720 Benedict Dr
- 6724 Benedict Dr
- 6744 Fry Rd Unit 4
- 16761 Orchard Grove Dr Unit 6808A
- 6689 Fry Rd
- 6040 Slater Dr
- 16445 Heather Ln Unit 203
- 16475 Heather Ln Unit S202
- 16415 Heather Ln Unit F103
- 6377 Ledgebrook Dr
- 20415 Brookstone Trail
- 6759 Quarrystone Ln
- 16001 Sylvia Dr
- 18256 Sheldon Rd
- 18150 Sheldon Rd
- 18140 Sheldon Rd
- 18120 Sheldon Rd
- 18300 Sheldon Rd
- 18324 Sheldon Rd
- 18070 Sheldon Rd
- 18185 Dale Dr
- 18171 Dale Dr
- 18209 Dale Dr
- 6554 Grosse Dr
- 18157 Dale Dr
- 18235 Dale Dr
- 18348 Sheldon Rd
- 6546 Grosse Dr
- 18040 Sheldon Rd
- 18257 Dale Dr
- 6538 Grosse Dr
- 18283 Dale Dr
- 6530 Grosse Dr
Your Personal Tour Guide
Ask me questions while you tour the home.