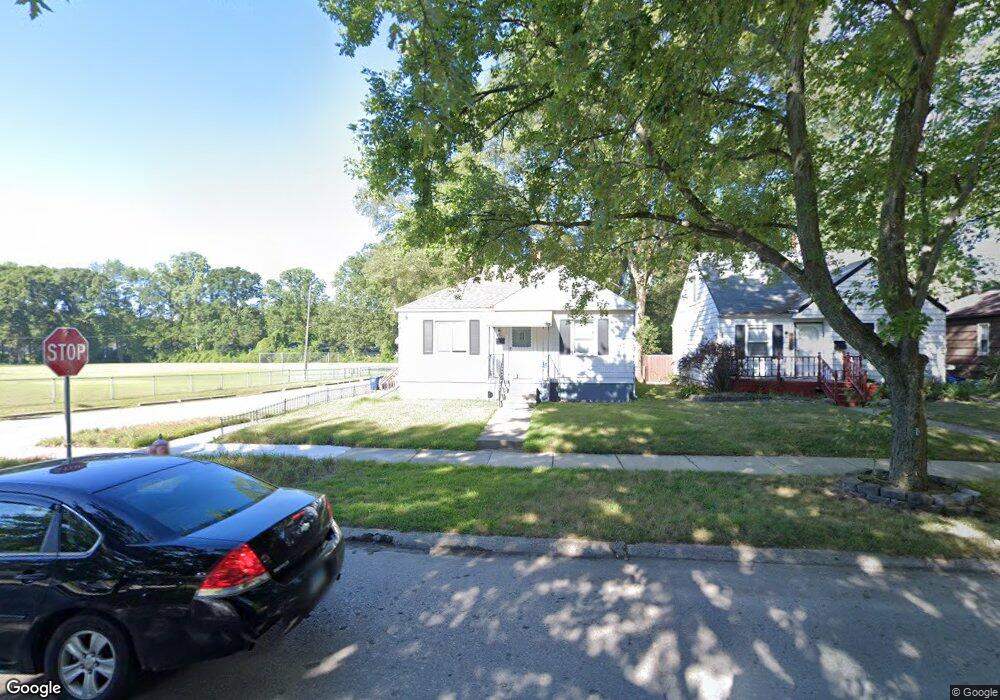
18201 Brady Unit Bldg-Unit Redford, MI 48240
Estimated Value: $115,000 - $138,000
--
Bed
1
Bath
760
Sq Ft
$164/Sq Ft
Est. Value
About This Home
This home is located at 18201 Brady Unit Bldg-Unit, Redford, MI 48240 and is currently estimated at $124,821, approximately $164 per square foot. 18201 Brady Unit Bldg-Unit is a home located in Wayne County with nearby schools including Beech Elementary School, Hilbert Middle School, and Redford Union High School.
Ownership History
Date
Name
Owned For
Owner Type
Purchase Details
Closed on
Jun 6, 2018
Sold by
Pastor 4G Llc
Bought by
Towler Taylor
Current Estimated Value
Purchase Details
Closed on
May 9, 2016
Sold by
The Estate Of Walter S Brent
Bought by
Pastor 4G Llc
Purchase Details
Closed on
Jan 7, 1998
Sold by
Brent Elsie Brent
Bought by
Brent Walter S
Create a Home Valuation Report for This Property
The Home Valuation Report is an in-depth analysis detailing your home's value as well as a comparison with similar homes in the area
Home Values in the Area
Average Home Value in this Area
Purchase History
| Date | Buyer | Sale Price | Title Company |
|---|---|---|---|
| Towler Taylor | $58,200 | None Available | |
| Pastor 4G Llc | $10,500 | Attorney | |
| Brent Walter S | -- | -- |
Source: Public Records
Tax History Compared to Growth
Tax History
| Year | Tax Paid | Tax Assessment Tax Assessment Total Assessment is a certain percentage of the fair market value that is determined by local assessors to be the total taxable value of land and additions on the property. | Land | Improvement |
|---|---|---|---|---|
| 2025 | $786 | $56,000 | $0 | $0 |
| 2024 | $786 | $51,200 | $0 | $0 |
| 2023 | $750 | $42,000 | $0 | $0 |
| 2022 | $1,877 | $36,500 | $0 | $0 |
| 2021 | $1,825 | $33,200 | $0 | $0 |
| 2020 | $1,801 | $27,500 | $0 | $0 |
| 2019 | $1,762 | $25,700 | $0 | $0 |
| 2018 | $866 | $19,200 | $0 | $0 |
| 2017 | $1,878 | $18,600 | $0 | $0 |
| 2016 | $1,085 | $18,700 | $0 | $0 |
| 2015 | $1,717 | $17,200 | $0 | $0 |
| 2013 | $1,700 | $17,700 | $0 | $0 |
| 2012 | $1,169 | $19,800 | $6,400 | $13,400 |
Source: Public Records
Map
Nearby Homes