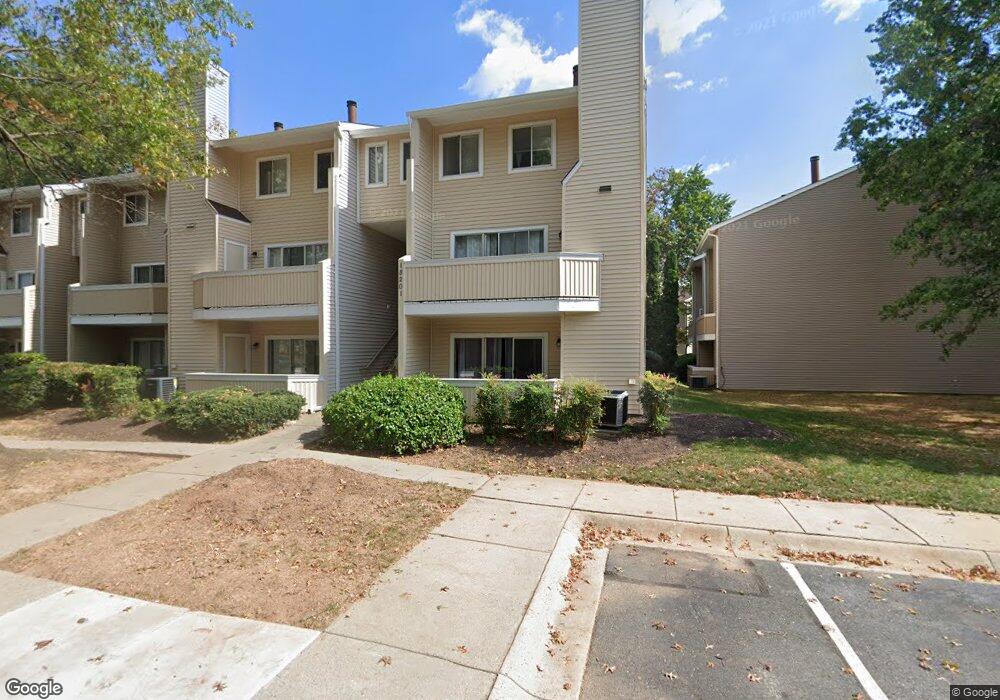
18201 Chalet Dr Unit 11111 Germantown, MD 20874
Estimated Value: $267,869 - $298,000
--
Bed
--
Bath
1,051
Sq Ft
$268/Sq Ft
Est. Value
About This Home
This home is located at 18201 Chalet Dr Unit 11111, Germantown, MD 20874 and is currently estimated at $281,467, approximately $267 per square foot. 18201 Chalet Dr Unit 11111 is a home located in Montgomery County with nearby schools including Great Seneca Creek Elementary, Kingsview Middle, and Northwest High School.
Ownership History
Date
Name
Owned For
Owner Type
Purchase Details
Closed on
Feb 11, 2004
Sold by
Kelley C Roy
Bought by
Mendoza Juan C
Current Estimated Value
Purchase Details
Closed on
Dec 9, 2003
Sold by
Neal Cecil G 2Nd
Bought by
Kelley C Roy
Purchase Details
Closed on
Apr 10, 2001
Sold by
Neal Cecil G 2Nd
Bought by
Neal Cecil G 2Nd and Likisha S
Purchase Details
Closed on
Mar 18, 1998
Sold by
Sec Of Housing & Urban Dev
Bought by
Cecil G Neal 2Nd
Purchase Details
Closed on
Jul 14, 1997
Sold by
Foreman Michael K
Bought by
Sec Of Housing & Urban Dev
Purchase Details
Closed on
Jan 31, 1995
Sold by
Mcdonald Margaret G
Bought by
Foreman Michael K
Home Financials for this Owner
Home Financials are based on the most recent Mortgage that was taken out on this home.
Original Mortgage
$70,400
Interest Rate
9.24%
Create a Home Valuation Report for This Property
The Home Valuation Report is an in-depth analysis detailing your home's value as well as a comparison with similar homes in the area
Home Values in the Area
Average Home Value in this Area
Purchase History
| Date | Buyer | Sale Price | Title Company |
|---|---|---|---|
| Mendoza Juan C | $165,000 | -- | |
| Mendoza Juan C | $165,000 | -- | |
| Kelley C Roy | $112,000 | -- | |
| Neal Cecil G 2Nd | -- | -- | |
| Cecil G Neal 2Nd | $72,420 | -- | |
| Sec Of Housing & Urban Dev | $77,305 | -- | |
| Foreman Michael K | $74,250 | -- |
Source: Public Records
Mortgage History
| Date | Status | Borrower | Loan Amount |
|---|---|---|---|
| Previous Owner | Foreman Michael K | $70,400 |
Source: Public Records
Tax History Compared to Growth
Tax History
| Year | Tax Paid | Tax Assessment Tax Assessment Total Assessment is a certain percentage of the fair market value that is determined by local assessors to be the total taxable value of land and additions on the property. | Land | Improvement |
|---|---|---|---|---|
| 2025 | $2,685 | $250,000 | $75,000 | $175,000 |
| 2024 | $2,685 | $226,667 | $0 | $0 |
| 2023 | $2,413 | $203,333 | $0 | $0 |
| 2022 | $1,451 | $180,000 | $54,000 | $126,000 |
| 2021 | $1,228 | $168,333 | $0 | $0 |
| 2020 | $1,512 | $156,667 | $0 | $0 |
| 2019 | $2,270 | $145,000 | $43,500 | $101,500 |
| 2018 | $1,661 | $145,000 | $43,500 | $101,500 |
| 2017 | $998 | $145,000 | $0 | $0 |
| 2016 | -- | $145,000 | $0 | $0 |
| 2015 | $745 | $140,000 | $0 | $0 |
| 2014 | $745 | $135,000 | $0 | $0 |
Source: Public Records
Map
Nearby Homes
- 13121 Wonderland Way
- 13139 Dairymaid Dr Unit 99/T-1
- 18217 Swiss Cir Unit 3
- 13257 Wonderland Way Unit 101
- 18011 Chalet Dr Unit 102
- 13104 Wonderland Way Unit 1
- 13135 Dairymaid Dr Unit 101
- 18131 Chalet Dr Unit 202
- 18050 Chalet Dr
- 13041 Well House Ct
- 13030 Mill House Ct
- 13304 Rising Sun Ln
- 18719 Harmony Woods Ln
- 18708 Lake Mary Celeste Ln
- 18473 Stone Hollow Dr
- 18457 Stone Hollow Dr
- 13107 Millhaven Place Unit N
- 13417 Rising Sun Ln
- 18605 Glen Willow Way
- 18633 Village Fountain Dr
- 18201 Chalet Dr Unit 11112
- 18201 Chalet Dr Unit 5
- 18201 Chalet Dr Unit 4
- 18201 Chalet Dr Unit 11115
- 18201 Chalet Dr Unit 3
- 18201 Chalet Dr Unit 5 (11-113)
- 18203 Chalet Dr Unit 4
- 18203 Chalet Dr Unit 5
- 18203 Chalet Dr Unit 6
- 18203 Chalet Dr
- 18203 Chalet Dr Unit 1
- 18203 Chalet Dr Unit 3
- 13131 Wonderland Way
- 13131 Wonderland Way Unit 3
- 13131 Wonderland Way
- 13131 Wonderland Way
- 13131 Wonderland Way
- 13131 Wonderland Way Unit 5
- 13131 Wonderland Way Unit 4
- 18217 Swiss Cir Unit 280