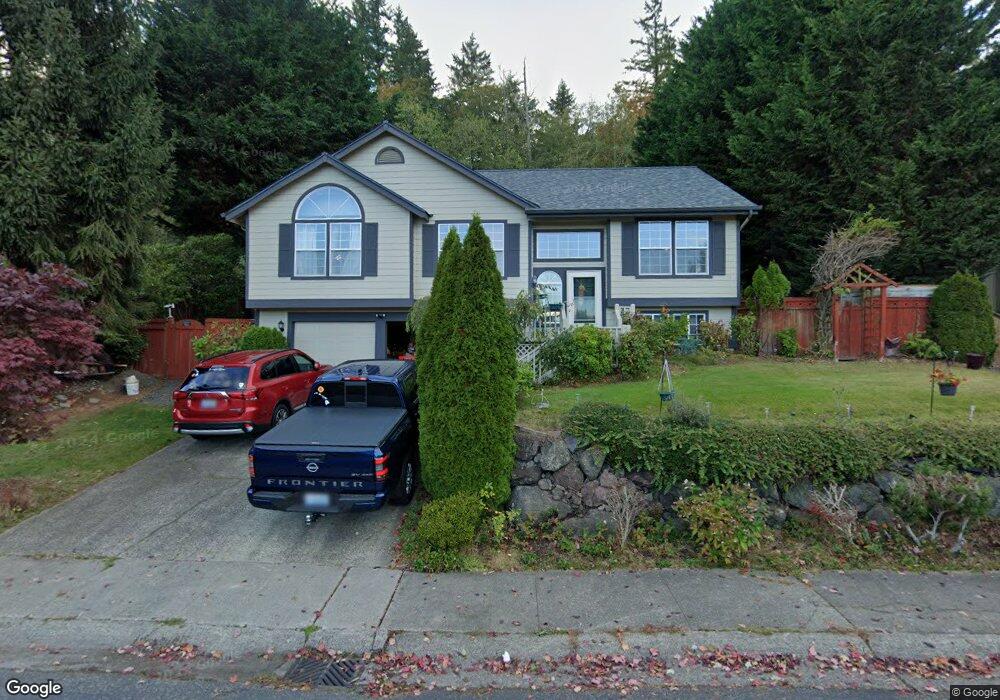
18201 Miss Ellis Loop NE Poulsbo, WA 98370
Estimated Value: $607,454 - $667,000
3
Beds
4
Baths
2,163
Sq Ft
$298/Sq Ft
Est. Value
About This Home
This home is located at 18201 Miss Ellis Loop NE, Poulsbo, WA 98370 and is currently estimated at $645,364, approximately $298 per square foot. 18201 Miss Ellis Loop NE is a home located in Kitsap County with nearby schools including Poulsbo Elementary School, Poulsbo Middle School, and North Kitsap High School.
Ownership History
Date
Name
Owned For
Owner Type
Purchase Details
Closed on
Jun 13, 2008
Sold by
Jamrog David S and Jamrog Patricia E
Bought by
Sharp James E and Sharp Maria Consuelo
Current Estimated Value
Home Financials for this Owner
Home Financials are based on the most recent Mortgage that was taken out on this home.
Original Mortgage
$294,900
Outstanding Balance
$189,139
Interest Rate
6.04%
Mortgage Type
Purchase Money Mortgage
Estimated Equity
$456,225
Purchase Details
Closed on
Feb 21, 2002
Sold by
Fike Roger and Fike Catherine
Bought by
Jamrog David S and Martin Patricia E
Home Financials for this Owner
Home Financials are based on the most recent Mortgage that was taken out on this home.
Original Mortgage
$203,200
Interest Rate
6.8%
Purchase Details
Closed on
Oct 15, 1997
Sold by
Schneider Homes Inc
Bought by
Fike Roger and Fike Catherine
Home Financials for this Owner
Home Financials are based on the most recent Mortgage that was taken out on this home.
Original Mortgage
$146,650
Interest Rate
7.49%
Create a Home Valuation Report for This Property
The Home Valuation Report is an in-depth analysis detailing your home's value as well as a comparison with similar homes in the area
Home Values in the Area
Average Home Value in this Area
Purchase History
| Date | Buyer | Sale Price | Title Company |
|---|---|---|---|
| Sharp James E | $330,180 | Transnation Title Ins Co | |
| Jamrog David S | $213,900 | Transnation Title Ins Co | |
| Fike Roger | $154,400 | Transnation Title Insurance |
Source: Public Records
Mortgage History
| Date | Status | Borrower | Loan Amount |
|---|---|---|---|
| Open | Sharp James E | $294,900 | |
| Previous Owner | Jamrog David S | $203,200 | |
| Previous Owner | Fike Roger | $146,650 |
Source: Public Records
Tax History Compared to Growth
Tax History
| Year | Tax Paid | Tax Assessment Tax Assessment Total Assessment is a certain percentage of the fair market value that is determined by local assessors to be the total taxable value of land and additions on the property. | Land | Improvement |
|---|---|---|---|---|
| 2026 | $4,731 | $527,230 | $113,760 | $413,470 |
| 2025 | $4,731 | $527,230 | $113,760 | $413,470 |
| 2024 | $4,344 | $498,470 | $106,370 | $392,100 |
| 2023 | $4,418 | $498,470 | $106,370 | $392,100 |
| 2022 | $3,918 | $420,340 | $92,340 | $328,000 |
| 2021 | $3,790 | $376,800 | $82,730 | $294,070 |
| 2020 | $3,685 | $359,920 | $79,040 | $280,880 |
| 2019 | $3,459 | $337,780 | $73,870 | $263,910 |
| 2018 | $3,132 | $260,520 | $56,100 | $204,420 |
| 2017 | $2,994 | $260,520 | $56,100 | $204,420 |
| 2016 | $3,085 | $247,230 | $56,100 | $191,130 |
| 2015 | $2,993 | $241,110 | $56,100 | $185,010 |
| 2014 | -- | $231,940 | $56,100 | $175,840 |
| 2013 | -- | $231,940 | $56,100 | $175,840 |
Source: Public Records
Map
Nearby Homes
- 18130 Sunrise Ridge Ave NE
- 1610 NE Mount Kamela Ct
- 18552 15th Loop NE
- 2405 NE Waterlily Way
- 17505 NE Midnight Sun Loop
- Luna Plan at Liberty Bay Vista
- Rainier Plan at Liberty Bay Vista
- Bennett Plan at Liberty Bay Vista
- Bennett (Basement) Plan at Liberty Bay Vista
- Noah (Basement) Plan at Liberty Bay Vista
- Warren Plan at Liberty Bay Vista
- Raymond Plan at Liberty Bay Vista
- Asher Plan at Liberty Bay Vista
- Noah Plan at Liberty Bay Vista
- Luna (Basement) Plan at Liberty Bay Vista
- 2040 NE Norseman Way
- 2019 NE Norseman Way
- 2046 NE Norseman Way
- 2052 NE Norseman Way
- 17523 NE Midnight Sun Loop
- 18227 Miss Ellis Loop NE
- 18175 Miss Ellis Loop NE
- 18214 Miss Ellis Loop NE
- 18178 Miss Ellis Loop NE
- 18265 Miss Ellis Loop NE
- 18151 Miss Ellis Loop NE
- 18256 Miss Ellis Loop NE
- 18154 Miss Ellis Loop NE
- 1956 NE Bjorn St
- 18127 Miss Ellis Loop NE
- 1961 NE Bjorn St
- 18280 Miss Ellis Loop NE
- 18130 Miss Ellis Loop NE
- 18183 Sunrise Ridge Ave NE
- 18169 Sunrise Ridge Ave NE
- 18201 Sunrise Ridge Ave NE
- 18311 Miss Ellis Loop NE
- 1973 NE Selsund Ct
- 1980 NE Bjorn St