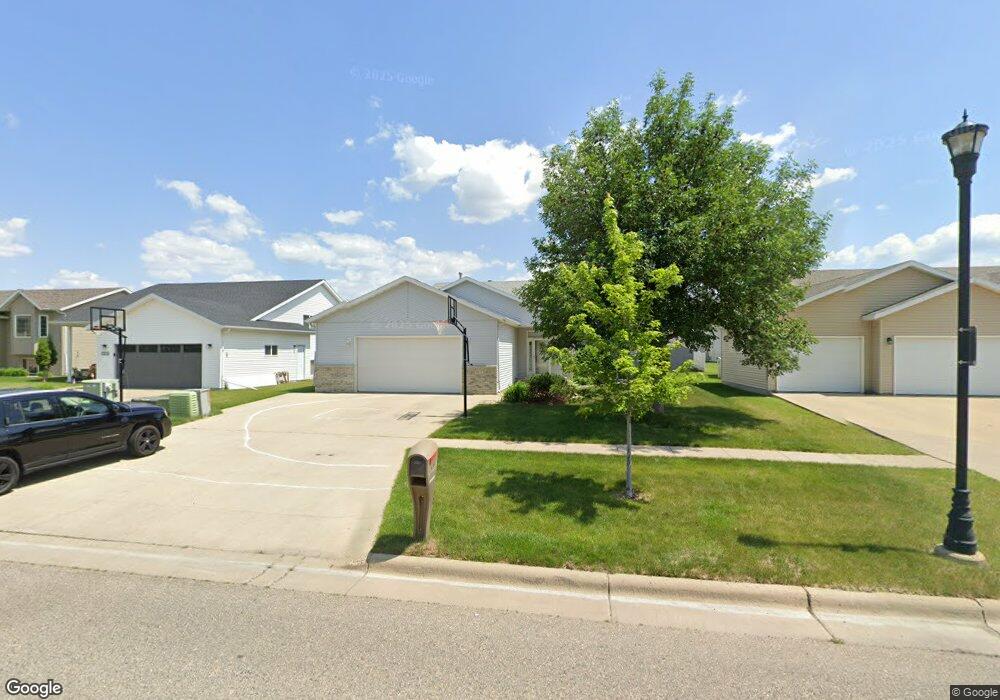
1821 7th St W West Fargo, ND 58078
Elmwood Court NeighborhoodEstimated Value: $341,000 - $368,737
4
Beds
3
Baths
2,448
Sq Ft
$145/Sq Ft
Est. Value
About This Home
This home is located at 1821 7th St W, West Fargo, ND 58078 and is currently estimated at $354,869, approximately $144 per square foot. 1821 7th St W is a home located in Cass County with nearby schools including Westside Elementary School, Cheney Middle School, and West Fargo High School.
Ownership History
Date
Name
Owned For
Owner Type
Purchase Details
Closed on
Dec 28, 2018
Sold by
Larson Eric D and Larson Kelli M
Bought by
Nelson Sheena L and Sunde Tylor T
Current Estimated Value
Home Financials for this Owner
Home Financials are based on the most recent Mortgage that was taken out on this home.
Original Mortgage
$190,800
Outstanding Balance
$168,758
Interest Rate
4.9%
Mortgage Type
New Conventional
Estimated Equity
$186,111
Purchase Details
Closed on
Mar 19, 2010
Sold by
Senechal Matthew and Senechal Lori
Bought by
Larson Eric D and Larson Kellie M
Home Financials for this Owner
Home Financials are based on the most recent Mortgage that was taken out on this home.
Original Mortgage
$136,000
Interest Rate
5%
Mortgage Type
New Conventional
Create a Home Valuation Report for This Property
The Home Valuation Report is an in-depth analysis detailing your home's value as well as a comparison with similar homes in the area
Home Values in the Area
Average Home Value in this Area
Purchase History
| Date | Buyer | Sale Price | Title Company |
|---|---|---|---|
| Nelson Sheena L | $238,500 | None Available | |
| Larson Eric D | -- | -- |
Source: Public Records
Mortgage History
| Date | Status | Borrower | Loan Amount |
|---|---|---|---|
| Open | Nelson Sheena L | $190,800 | |
| Previous Owner | Larson Eric D | $136,000 |
Source: Public Records
Tax History Compared to Growth
Tax History
| Year | Tax Paid | Tax Assessment Tax Assessment Total Assessment is a certain percentage of the fair market value that is determined by local assessors to be the total taxable value of land and additions on the property. | Land | Improvement |
|---|---|---|---|---|
| 2024 | $4,124 | $158,450 | $23,400 | $135,050 |
| 2023 | $4,553 | $155,350 | $23,400 | $131,950 |
| 2022 | $4,473 | $146,200 | $23,400 | $122,800 |
| 2021 | $4,131 | $129,050 | $18,700 | $110,350 |
| 2020 | $4,006 | $129,600 | $18,700 | $110,900 |
| 2019 | $3,757 | $125,400 | $18,700 | $106,700 |
| 2018 | $3,699 | $129,050 | $18,700 | $110,350 |
| 2017 | $3,585 | $127,950 | $18,700 | $109,250 |
| 2016 | $3,188 | $124,800 | $18,700 | $106,100 |
| 2015 | $3,118 | $112,050 | $12,800 | $99,250 |
| 2014 | $3,057 | $104,700 | $12,800 | $91,900 |
| 2013 | $2,907 | $102,000 | $12,800 | $89,200 |
Source: Public Records
Map
Nearby Homes
- 723 16th Ave W
- 1447 Elmwood Ct
- 1633 3rd St W
- 1264 Marlys Dr W
- 1844 1st St
- 232 15th Ave W
- 134 17th Ave E
- 830 12th Ave W
- 1029 Highland Ln W
- 1179 Highland Ln W
- 1043 Barnes Dr W
- 2101 10th St W
- 517 18th Ave E
- 154 W Beaton Dr
- 1234 Highland Ln W
- 2170 Dock Dr
- 226 10 1/2 Ave W
- 744 Elm St
- 243 12 1 2 Ave E
- 2216 10th Ct W