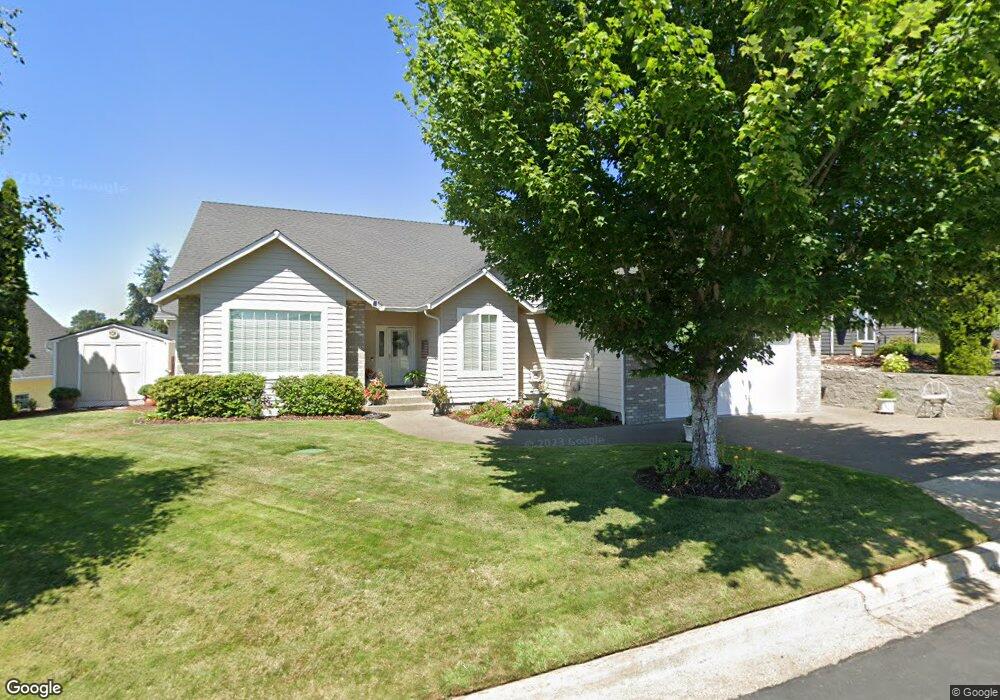
1821 Culver Loop Sutherlin, OR 97479
Estimated Value: $473,699 - $573,000
3
Beds
2
Baths
2,351
Sq Ft
$226/Sq Ft
Est. Value
About This Home
This home is located at 1821 Culver Loop, Sutherlin, OR 97479 and is currently estimated at $530,675, approximately $225 per square foot. 1821 Culver Loop is a home located in Douglas County with nearby schools including East Sutherlin Primary School, West Sutherlin Intermediate School, and Sutherlin Middle School.
Ownership History
Date
Name
Owned For
Owner Type
Purchase Details
Closed on
Dec 7, 2005
Sold by
Britzius Adam G and Britzius Jennifer S
Bought by
Rushing David Thomas and Rushing Betty Louise
Current Estimated Value
Purchase Details
Closed on
Feb 9, 2005
Sold by
Avery Gordon
Bought by
Britzius Adam G and Britzius Jennifer S
Home Financials for this Owner
Home Financials are based on the most recent Mortgage that was taken out on this home.
Original Mortgage
$327,650
Interest Rate
6.37%
Mortgage Type
New Conventional
Purchase Details
Closed on
Jan 18, 2005
Sold by
Neuner Grace M
Bought by
Neuner Grace M and Grace M Neuner Living Trust
Home Financials for this Owner
Home Financials are based on the most recent Mortgage that was taken out on this home.
Original Mortgage
$327,650
Interest Rate
6.37%
Mortgage Type
New Conventional
Create a Home Valuation Report for This Property
The Home Valuation Report is an in-depth analysis detailing your home's value as well as a comparison with similar homes in the area
Home Values in the Area
Average Home Value in this Area
Purchase History
| Date | Buyer | Sale Price | Title Company |
|---|---|---|---|
| Rushing David Thomas | $354,000 | Amerititle Inc | |
| Britzius Adam G | $344,900 | Ticor Title | |
| Neuner Grace M | -- | -- |
Source: Public Records
Mortgage History
| Date | Status | Borrower | Loan Amount |
|---|---|---|---|
| Previous Owner | Britzius Adam G | $327,650 |
Source: Public Records
Tax History
| Year | Tax Paid | Tax Assessment Tax Assessment Total Assessment is a certain percentage of the fair market value that is determined by local assessors to be the total taxable value of land and additions on the property. | Land | Improvement |
|---|---|---|---|---|
| 2025 | $3,955 | $333,161 | -- | -- |
| 2024 | $3,869 | $323,458 | -- | -- |
| 2023 | $3,758 | $314,037 | $0 | $0 |
| 2022 | $3,650 | $304,891 | $0 | $0 |
| 2021 | $3,546 | $296,011 | $0 | $0 |
| 2020 | $3,442 | $287,390 | $0 | $0 |
| 2019 | $3,342 | $279,020 | $0 | $0 |
| 2018 | $3,244 | $270,894 | $0 | $0 |
| 2017 | $3,324 | $263,004 | $0 | $0 |
| 2016 | $3,228 | $255,344 | $0 | $0 |
| 2015 | $3,134 | $247,907 | $0 | $0 |
| 2014 | $3,041 | $240,687 | $0 | $0 |
| 2013 | -- | $233,677 | $0 | $0 |
Source: Public Records
Map
Nearby Homes
- 702 Divot Loop
- 0 Scardi Blvd Unit Lot 101
- 0 Scardi Blvd Unit Lot 1
- 1716 Scardi Blvd Unit 174
- 832 Sand Pines Ave
- 607 Wildcat Canyon Rd
- 582 Fairway Estates Dr
- 941 Sand Pines Ave
- 881 Medina Ave
- 811 Pebble Creek St
- 909 Durham Ave
- 324 Dakota St
- 376 Bentgrass Ct
- 263 Addison Ave
- 1688 W Central Ave
- 181 SW Hutchins St
- 135 Elkton St
- 126 Coles Valley St
- 157 Elkton St
- 303 Ashwood St
- 0 Arnie Ct
- 1825 Culver Loop
- 1799 Culver Loop
- 1797 Culver Loop
- 1797 Culver Loop Unit 118
- 616 Arnie Ct
- 1798 Culver Loop
- 1827 Culver Loop
- 1826 Culver Loop
- 615 Arnie Ct
- 1796 Culver Loop
- 1796 Culver Loop Unit 129
- 1795 Culver Loop
- 1828 Culver Loop
- 601 Arnie Ct
- 1829 Culver Loop
- 1793 Culver Loop
- 703 Sandpiper Ct
- 716 Sandpiper Ct
Your Personal Tour Guide
Ask me questions while you tour the home.