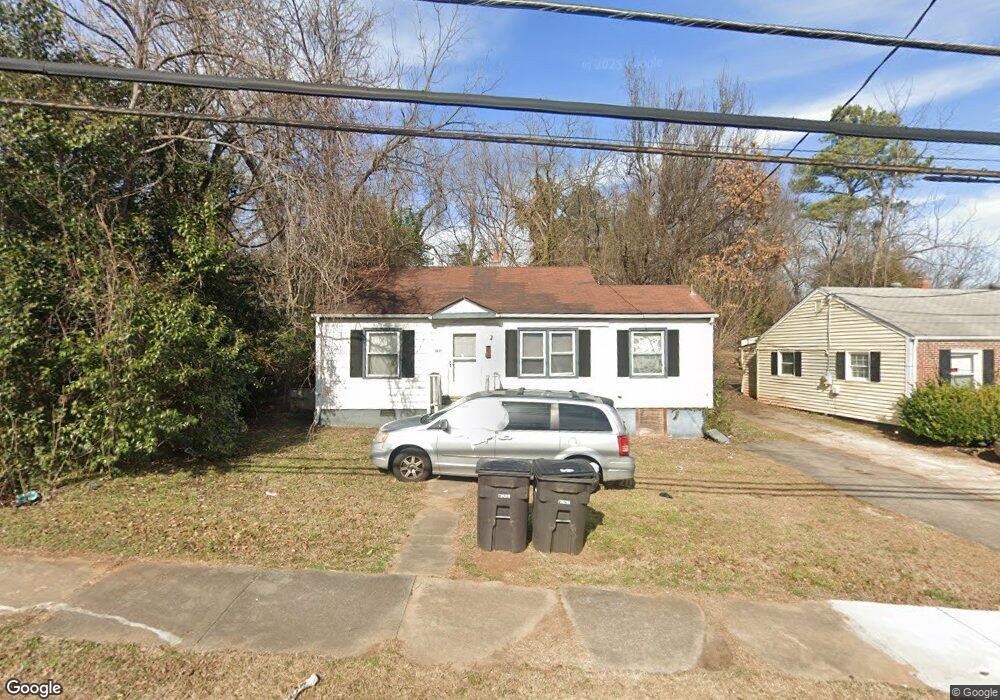
1821 E 3rd St Winston Salem, NC 27101
Skyland NeighborhoodEstimated Value: $94,000 - $112,255
3
Beds
2
Baths
1,584
Sq Ft
$66/Sq Ft
Est. Value
About This Home
This home is located at 1821 E 3rd St, Winston Salem, NC 27101 and is currently estimated at $105,064, approximately $66 per square foot. 1821 E 3rd St is a home located in Forsyth County with nearby schools including Petree Elementary, East Forsyth Middle, and Carver High School.
Ownership History
Date
Name
Owned For
Owner Type
Purchase Details
Closed on
Jun 11, 2014
Sold by
Watson Robbie Martin and Watson Robbie M
Bought by
Bank Of North Carolina
Current Estimated Value
Purchase Details
Closed on
Oct 17, 2005
Sold by
Granite Mortgage Inc
Bought by
Watson Robbie M and Watson Shelbia J
Home Financials for this Owner
Home Financials are based on the most recent Mortgage that was taken out on this home.
Original Mortgage
$44,000
Interest Rate
6.04%
Mortgage Type
Purchase Money Mortgage
Purchase Details
Closed on
Sep 28, 2005
Sold by
Riddick Shirelle S and Riddick Kerry C
Bought by
Granite Mortgage Inc
Home Financials for this Owner
Home Financials are based on the most recent Mortgage that was taken out on this home.
Original Mortgage
$44,000
Interest Rate
6.04%
Mortgage Type
Purchase Money Mortgage
Create a Home Valuation Report for This Property
The Home Valuation Report is an in-depth analysis detailing your home's value as well as a comparison with similar homes in the area
Home Values in the Area
Average Home Value in this Area
Purchase History
| Date | Buyer | Sale Price | Title Company |
|---|---|---|---|
| Bank Of North Carolina | $193,500 | None Available | |
| Watson Robbie M | $44,000 | -- | |
| Granite Mortgage Inc | $50,000 | -- |
Source: Public Records
Mortgage History
| Date | Status | Borrower | Loan Amount |
|---|---|---|---|
| Previous Owner | Watson Robbie M | $44,000 |
Source: Public Records
Tax History
| Year | Tax Paid | Tax Assessment Tax Assessment Total Assessment is a certain percentage of the fair market value that is determined by local assessors to be the total taxable value of land and additions on the property. | Land | Improvement |
|---|---|---|---|---|
| 2025 | $295 | $72,000 | $12,000 | $60,000 |
| 2024 | $281 | $21,000 | $6,500 | $14,500 |
| 2023 | $281 | $21,000 | $6,500 | $14,500 |
| 2022 | $276 | $21,000 | $6,500 | $14,500 |
| 2021 | $271 | $21,000 | $6,500 | $14,500 |
| 2020 | $200 | $14,500 | $6,500 | $8,000 |
| 2019 | $202 | $14,500 | $6,500 | $8,000 |
| 2018 | $192 | $14,500 | $6,500 | $8,000 |
| 2016 | $272 | $20,734 | $6,500 | $14,234 |
Source: Public Records
Map
Nearby Homes
- 1807 E 4th St
- 1919 Maryland Ave
- 517 N Cameron Ave
- 1969 Maryland Ave
- 224 N Graham Ave
- 608 N Cameron Ave
- 0 N Cameron Ave
- 605 N Dunleith Ave
- 613 N Dunleith Ave
- 0 S Jackson Ave
- 1415 E 4th St
- 212 N Laura Wall Blvd
- 806 Rankin St
- 849 Rankin St
- 1065 Claremont Ave NE
- 2642 Belews Creek Rd
- 114 Hicks St
- 2332 Slater Ave
- 609 Mount Vernon Ave
- 2903 Old Greensboro Rd
Your Personal Tour Guide
Ask me questions while you tour the home.