Estimated Value: $233,461 - $258,000
3
Beds
2
Baths
1,498
Sq Ft
$165/Sq Ft
Est. Value
About This Home
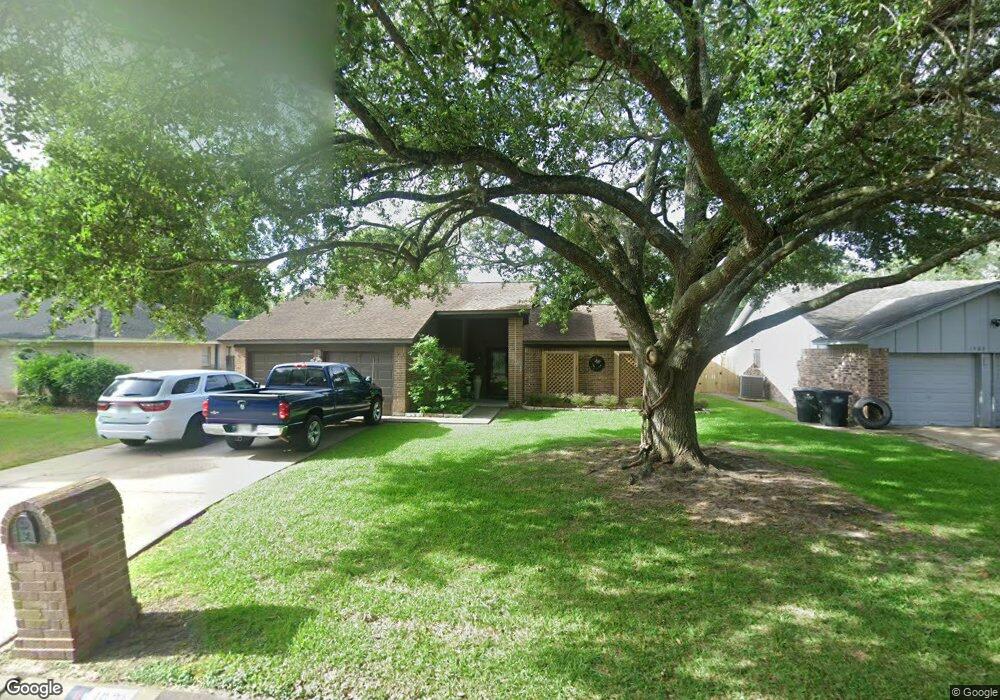
This home is located at 1821 Fulton St, Alvin, TX 77511 and is currently estimated at $247,865, approximately $165 per square foot. 1821 Fulton St is a home located in Brazoria County with nearby schools including Melba Passmore Elementary School, Fairview Junior High School, and Alvin High School.
Ownership History
Date
Name
Owned For
Owner Type
Purchase Details
Closed on
Sep 18, 2015
Sold by
Romero Carol Ann
Bought by
Hernandez Erin L
Current Estimated Value
Home Financials for this Owner
Home Financials are based on the most recent Mortgage that was taken out on this home.
Original Mortgage
$139,428
Outstanding Balance
$108,910
Interest Rate
3.75%
Mortgage Type
FHA
Estimated Equity
$138,955
Purchase Details
Closed on
Dec 17, 1999
Sold by
Zinke Kevin W and Zinke Julie L
Bought by
Romero Carol Ann
Home Financials for this Owner
Home Financials are based on the most recent Mortgage that was taken out on this home.
Original Mortgage
$87,423
Interest Rate
7.71%
Mortgage Type
FHA
Purchase Details
Closed on
Jun 14, 1995
Sold by
Kinsworthy Danny Mack and Kinsworthy Linda S
Bought by
Zinke Kevin W and Zinke Julie L
Home Financials for this Owner
Home Financials are based on the most recent Mortgage that was taken out on this home.
Original Mortgage
$82,620
Interest Rate
9%
Mortgage Type
Assumption
Create a Home Valuation Report for This Property
The Home Valuation Report is an in-depth analysis detailing your home's value as well as a comparison with similar homes in the area
Home Values in the Area
Average Home Value in this Area
Purchase History
| Date | Buyer | Sale Price | Title Company |
|---|---|---|---|
| Hernandez Erin L | -- | Texas American Title Co | |
| Romero Carol Ann | -- | Chicago Title | |
| Zinke Kevin W | -- | -- |
Source: Public Records
Mortgage History
| Date | Status | Borrower | Loan Amount |
|---|---|---|---|
| Open | Hernandez Erin L | $139,428 | |
| Previous Owner | Romero Carol Ann | $87,423 | |
| Previous Owner | Zinke Kevin W | $82,620 |
Source: Public Records
Tax History Compared to Growth
Tax History
| Year | Tax Paid | Tax Assessment Tax Assessment Total Assessment is a certain percentage of the fair market value that is determined by local assessors to be the total taxable value of land and additions on the property. | Land | Improvement |
|---|---|---|---|---|
| 2025 | $3,545 | $211,600 | $23,150 | $188,450 |
| 2023 | $3,545 | $191,664 | $23,150 | $186,710 |
| 2022 | $4,779 | $174,240 | $23,150 | $155,300 |
| 2021 | $4,573 | $158,400 | $27,780 | $130,620 |
| 2020 | $4,364 | $149,100 | $23,820 | $125,280 |
| 2019 | $4,203 | $143,490 | $16,540 | $126,950 |
| 2018 | $3,827 | $127,200 | $16,540 | $110,660 |
| 2017 | $4,023 | $132,040 | $16,540 | $115,500 |
| 2016 | $3,962 | $130,010 | $16,540 | $113,470 |
| 2015 | $2,923 | $115,120 | $16,540 | $98,580 |
| 2014 | $2,923 | $106,750 | $16,540 | $90,210 |
Source: Public Records
Map
Nearby Homes
- 1655 Kost Rd
- 0 Kost Rd
- 1109 Hampton Cir
- 1503 Fairview Dr
- 1600 Rosharon Rd Unit 19
- 1312 W Adoue St
- 2306 Westfield St
- 1302 W Adoue St
- 256 Davis Bend Rd
- 2693 Fairview Dr
- 252 Davis Bend Rd
- 2195 W Lang St
- 405 W Lang St
- 218 W Blum St
- 1001 Rosharon Rd
- 1188 Filly Creek Dr
- 2514 Westfield St
- 1174 Filly Creek Dr
- 710 S Jackson St
- 1314 W Willis St