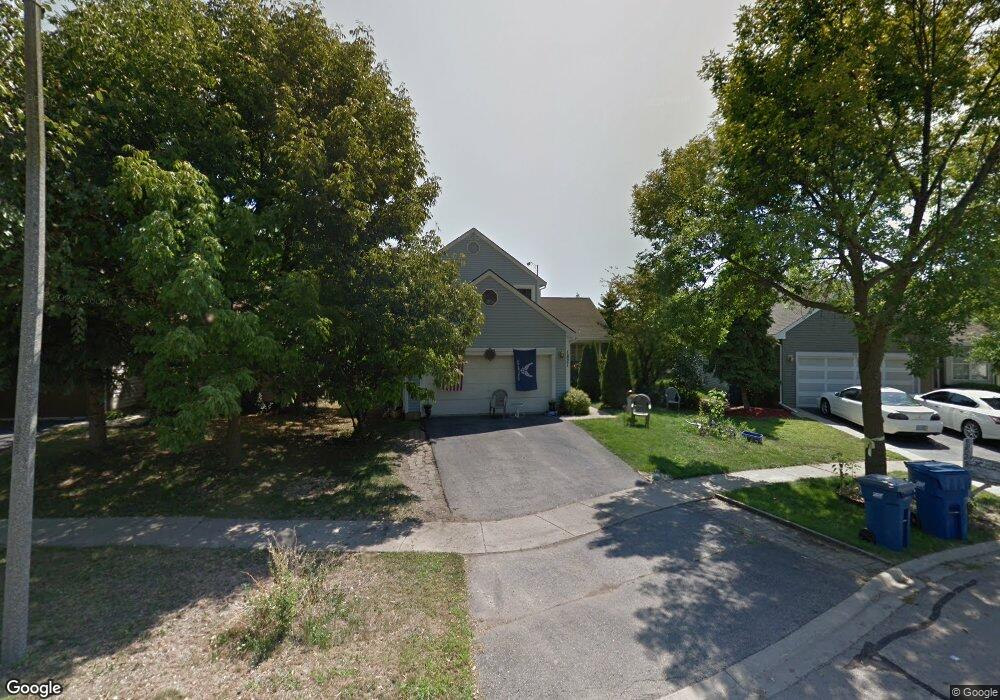
1821 Grosse Pointe Cir Hanover Park, IL 60133
South Tri Village NeighborhoodEstimated Value: $362,000 - $377,000
3
Beds
3
Baths
1,777
Sq Ft
$209/Sq Ft
Est. Value
About This Home
This home is located at 1821 Grosse Pointe Cir, Hanover Park, IL 60133 and is currently estimated at $371,027, approximately $208 per square foot. 1821 Grosse Pointe Cir is a home located in DuPage County with nearby schools including Elsie C. Johnson Elementary School, Stratford Middle School, and Glenbard North High School.
Ownership History
Date
Name
Owned For
Owner Type
Purchase Details
Closed on
Apr 13, 2000
Sold by
Sura Karamjit and Sura Rajni
Bought by
Tahara Naoya and Tahara Lauriel L
Current Estimated Value
Home Financials for this Owner
Home Financials are based on the most recent Mortgage that was taken out on this home.
Original Mortgage
$149,285
Outstanding Balance
$51,181
Interest Rate
8.24%
Mortgage Type
FHA
Estimated Equity
$319,846
Purchase Details
Closed on
Jul 28, 1997
Sold by
Barnett Randy B
Bought by
Sura Karamjitt and Sura Rajni
Home Financials for this Owner
Home Financials are based on the most recent Mortgage that was taken out on this home.
Original Mortgage
$135,992
Interest Rate
7.71%
Mortgage Type
FHA
Purchase Details
Closed on
Jul 6, 1995
Sold by
Derango Jeffery L and Derango Beth J
Bought by
Barnett Randy B
Home Financials for this Owner
Home Financials are based on the most recent Mortgage that was taken out on this home.
Original Mortgage
$114,400
Interest Rate
7.9%
Create a Home Valuation Report for This Property
The Home Valuation Report is an in-depth analysis detailing your home's value as well as a comparison with similar homes in the area
Home Values in the Area
Average Home Value in this Area
Purchase History
| Date | Buyer | Sale Price | Title Company |
|---|---|---|---|
| Tahara Naoya | $157,000 | -- | |
| Sura Karamjitt | $145,000 | Fox Title Company | |
| Barnett Randy B | $143,500 | West Counties Title Svcs Inc |
Source: Public Records
Mortgage History
| Date | Status | Borrower | Loan Amount |
|---|---|---|---|
| Open | Tahara Naoya | $149,285 | |
| Previous Owner | Sura Karamjitt | $135,992 | |
| Previous Owner | Barnett Randy B | $114,400 |
Source: Public Records
Tax History Compared to Growth
Tax History
| Year | Tax Paid | Tax Assessment Tax Assessment Total Assessment is a certain percentage of the fair market value that is determined by local assessors to be the total taxable value of land and additions on the property. | Land | Improvement |
|---|---|---|---|---|
| 2024 | $8,773 | $102,747 | $28,514 | $74,233 |
| 2023 | $8,199 | $93,220 | $25,870 | $67,350 |
| 2022 | $8,103 | $86,630 | $24,040 | $62,590 |
| 2021 | $7,786 | $82,240 | $22,820 | $59,420 |
| 2020 | $7,623 | $79,780 | $22,140 | $57,640 |
| 2019 | $7,356 | $76,930 | $21,350 | $55,580 |
| 2018 | $7,052 | $71,270 | $20,430 | $50,840 |
| 2017 | $6,986 | $68,430 | $19,620 | $48,810 |
| 2016 | $6,887 | $65,360 | $18,740 | $46,620 |
| 2015 | $6,961 | $61,870 | $17,740 | $44,130 |
| 2014 | $6,796 | $60,870 | $17,290 | $43,580 |
| 2013 | $6,732 | $62,320 | $17,700 | $44,620 |
Source: Public Records
Map
Nearby Homes
- 1885 Grosse Pointe Ct
- 1824 Isle Royal Ln
- 1925 Grosse Pointe Ct
- 1309 Coldspring Rd Unit 162
- 3867 Springlake Dr
- 2183 Wildwood Ct
- 1711 Fulton Ln
- 1390 Merrimac Ln N
- 1358 Woodlake Dr
- 2315 Stepstone Ln
- 1339 Narragansett Dr
- 4565 Dupont Dr
- 2320 Bayside Dr
- 2363 Cove Dr
- 457 Hadley Ct
- 2113 Glasgow Ct
- 2119 Glasgow Ct
- 1063 Parkview Cir
- 1772 Howe Ln
- 545 Woodhill Dr Unit 290902
- 1817 Grosse Pointe Cir
- 1825 Grosse Pointe Cir
- 1813 Grosse Pointe Cir
- 1829 Grosse Pointe Cir
- 1809 Grosse Pointe Cir
- 1833 Grosse Pointe Cir
- 1826 Grosse Pointe Cir
- 1822 Grosse Pointe Cir Unit 1
- 1805 Grosse Pointe Cir
- 1837 Grosse Pointe Cir
- 1818 Grosse Pointe Cir
- 3970 Ludington Ct
- 3960 Ludington Ct
- 1830 Grosse Pointe Cir
- 1841 Grosse Pointe Cir
- 3950 Ludington Ct
- 3980 Ludington Ct
- 1814 Grosse Pointe Cir
- 1834 Grosse Pointe Cir
- 3990 Ludington Ct