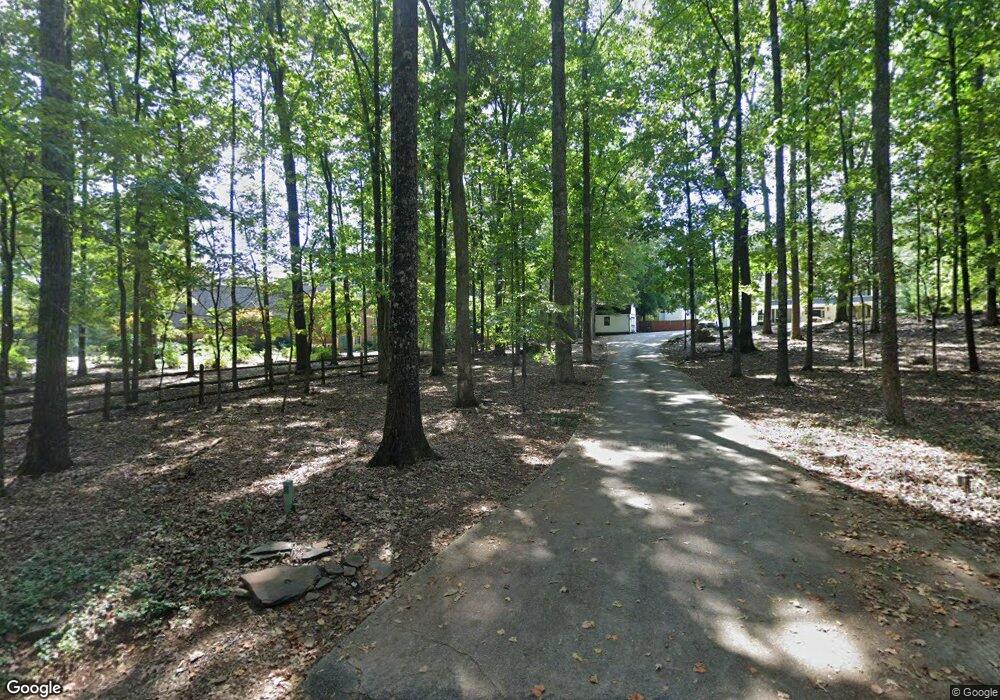
1821 Hays Mill Rd Carrollton, GA 30117
Estimated Value: $403,000 - $653,080
2
Beds
2
Baths
1,311
Sq Ft
$369/Sq Ft
Est. Value
About This Home
This home is located at 1821 Hays Mill Rd, Carrollton, GA 30117 and is currently estimated at $484,270, approximately $369 per square foot. 1821 Hays Mill Rd is a home located in Carroll County with nearby schools including Central Elementary School, Central Middle School, and Central High School.
Ownership History
Date
Name
Owned For
Owner Type
Purchase Details
Closed on
Jan 28, 2011
Sold by
United Community Bank
Bought by
Sprewell Sidney Harold
Current Estimated Value
Home Financials for this Owner
Home Financials are based on the most recent Mortgage that was taken out on this home.
Original Mortgage
$112,000
Outstanding Balance
$76,784
Interest Rate
4.82%
Mortgage Type
New Conventional
Estimated Equity
$407,486
Purchase Details
Closed on
Jan 21, 2010
Sold by
United Community Bank
Bought by
Sprewell Sidney Harold
Home Financials for this Owner
Home Financials are based on the most recent Mortgage that was taken out on this home.
Original Mortgage
$112,000
Interest Rate
4.82%
Mortgage Type
New Conventional
Purchase Details
Closed on
Nov 3, 2009
Sold by
Taylor Sharon L
Bought by
United Community Bank
Purchase Details
Closed on
Sep 28, 2000
Sold by
Garner J Wayne
Bought by
Taylor Sharon L
Purchase Details
Closed on
Aug 26, 1999
Sold by
Maxwell Rhudy Etal
Bought by
Garner J Wayne
Create a Home Valuation Report for This Property
The Home Valuation Report is an in-depth analysis detailing your home's value as well as a comparison with similar homes in the area
Home Values in the Area
Average Home Value in this Area
Purchase History
| Date | Buyer | Sale Price | Title Company |
|---|---|---|---|
| Sprewell Sidney Harold | $140,000 | -- | |
| Sprewell Sidney Harold | $140,000 | -- | |
| United Community Bank | $260,073 | -- | |
| Taylor Sharon L | $220,000 | -- | |
| Garner J Wayne | $165,000 | -- |
Source: Public Records
Mortgage History
| Date | Status | Borrower | Loan Amount |
|---|---|---|---|
| Open | United Community Bank | $112,000 | |
| Previous Owner | Sprewell Sidney Harold | $112,000 |
Source: Public Records
Tax History Compared to Growth
Tax History
| Year | Tax Paid | Tax Assessment Tax Assessment Total Assessment is a certain percentage of the fair market value that is determined by local assessors to be the total taxable value of land and additions on the property. | Land | Improvement |
|---|---|---|---|---|
| 2024 | $4,939 | $218,320 | $111,469 | $106,851 |
| 2023 | $4,939 | $186,735 | $89,175 | $97,560 |
| 2022 | $3,456 | $137,812 | $59,450 | $78,362 |
| 2021 | $2,956 | $115,308 | $47,560 | $67,748 |
| 2020 | $2,628 | $102,378 | $43,236 | $59,142 |
| 2019 | $2,510 | $96,982 | $43,236 | $53,746 |
| 2018 | $1,815 | $69,109 | $23,016 | $46,093 |
| 2017 | $1,832 | $69,560 | $23,016 | $46,544 |
| 2016 | $1,833 | $69,560 | $23,016 | $46,544 |
| 2015 | $1,975 | $70,615 | $36,054 | $34,562 |
| 2014 | $1,983 | $70,616 | $36,054 | $34,562 |
Source: Public Records
Map
Nearby Homes
- 1585 Hays Mill Rd
- 2214 Hays Mill Rd
- 915 Oak Grove Rd
- 2492 Oak Grove Church Rd
- 400 Stripling Chapel Rd
- 1250 Hays Mill Rd
- 533 Buffalo Creek Rd
- 135 Gray Rd
- 0 Buffalo Creek Rd Unit 10624169
- 121 Carson Place
- 50 Azalea Trail
- 116 Manor Way
- 221 Valley Ridge Dr
- 111 Vineyard Walk
- 111 Vineyard Walk Unit LOT 78
- 113 Vineyard Walk
- 113 Vineyard Walk Unit LOT 77
- 114 Sweetbriar Ln
- 110 Sweetbriar Ln
- 147 Roy North Rd
- 121 Roy North Rd
- 121 Roy Rd N
- 98 Sweetbriar Ln
- 130 Sweetbriar Ln
- 1810 Hays Mill Rd
- 107 Sweetbriar Ln
- 543 Oak Grove Rd
- 80 Sweetbriar Ln
- 156 Sweetbriar Ln
- 156 Sweetbriar Ln
- 515 Oak Grove Rd
- 125 Roy North Rd
- 0 Sweet Briar Ln Unit 7123365
- 0 Sweet Briar Ln
- 2862 Oak Grove Church Rd
- 1972 Hays Mill Rd
- 193 Roy North Rd