Estimated Value: $154,000 - $170,000
3
Beds
2
Baths
1,218
Sq Ft
$134/Sq Ft
Est. Value
About This Home
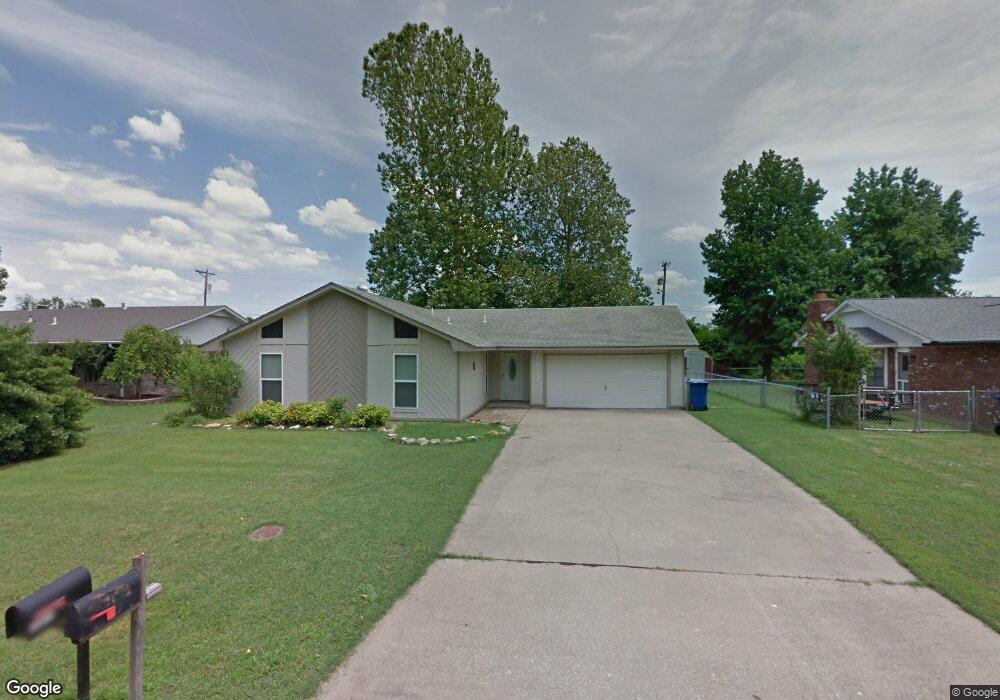
This home is located at 1821 K St SW, Miami, OK 74354 and is currently estimated at $163,078, approximately $133 per square foot. 1821 K St SW is a home located in Ottawa County with nearby schools including Miami High School.
Ownership History
Date
Name
Owned For
Owner Type
Purchase Details
Closed on
Aug 19, 2010
Sold by
Vicky Fleming Management Inc
Bought by
Hughes Kandace R
Current Estimated Value
Home Financials for this Owner
Home Financials are based on the most recent Mortgage that was taken out on this home.
Original Mortgage
$93,737
Outstanding Balance
$61,844
Interest Rate
4.5%
Mortgage Type
FHA
Estimated Equity
$101,234
Purchase Details
Closed on
May 24, 2010
Sold by
Secretary Of Hud Of Washington Dc
Bought by
Vicky Eleming Management Inc
Purchase Details
Closed on
Aug 3, 2006
Sold by
Bryant Ronnie Travis and Bryant Amanda Leeann
Bought by
Miller Jared
Home Financials for this Owner
Home Financials are based on the most recent Mortgage that was taken out on this home.
Original Mortgage
$77,140
Interest Rate
6.66%
Mortgage Type
FHA
Purchase Details
Closed on
Oct 2, 2002
Bought by
Bryant Ronnie and Bryant Amanda
Purchase Details
Closed on
Oct 29, 1996
Bought by
Pendergraft David Lee
Purchase Details
Closed on
Aug 25, 1995
Bought by
Walker Eli A and Walker Virginia
Create a Home Valuation Report for This Property
The Home Valuation Report is an in-depth analysis detailing your home's value as well as a comparison with similar homes in the area
Home Values in the Area
Average Home Value in this Area
Purchase History
| Date | Buyer | Sale Price | Title Company |
|---|---|---|---|
| Hughes Kandace R | $95,000 | None Available | |
| Vicky Eleming Management Inc | -- | None Available | |
| Miller Jared | $89,000 | None Available | |
| Bryant Ronnie | $71,500 | -- | |
| Pendergraft David Lee | $55,000 | -- | |
| Walker Eli A | $50,000 | -- |
Source: Public Records
Mortgage History
| Date | Status | Borrower | Loan Amount |
|---|---|---|---|
| Open | Hughes Kandace R | $93,737 | |
| Previous Owner | Miller Jared | $77,140 |
Source: Public Records
Tax History Compared to Growth
Tax History
| Year | Tax Paid | Tax Assessment Tax Assessment Total Assessment is a certain percentage of the fair market value that is determined by local assessors to be the total taxable value of land and additions on the property. | Land | Improvement |
|---|---|---|---|---|
| 2024 | $1,180 | $13,239 | $969 | $12,270 |
| 2023 | $1,180 | $12,854 | $969 | $11,885 |
| 2022 | $1,061 | $12,479 | $969 | $11,510 |
| 2021 | $1,050 | $12,116 | $969 | $11,147 |
| 2020 | $1,026 | $11,763 | $969 | $10,794 |
| 2019 | $856 | $11,420 | $969 | $10,451 |
| 2018 | $861 | $11,420 | $969 | $10,451 |
| 2017 | $853 | $11,155 | $969 | $10,186 |
| 2016 | $790 | $10,830 | $969 | $9,861 |
| 2015 | $724 | $8,151 | $731 | $7,420 |
| 2014 | $805 | $10,830 | $969 | $9,861 |
Source: Public Records
Map
Nearby Homes