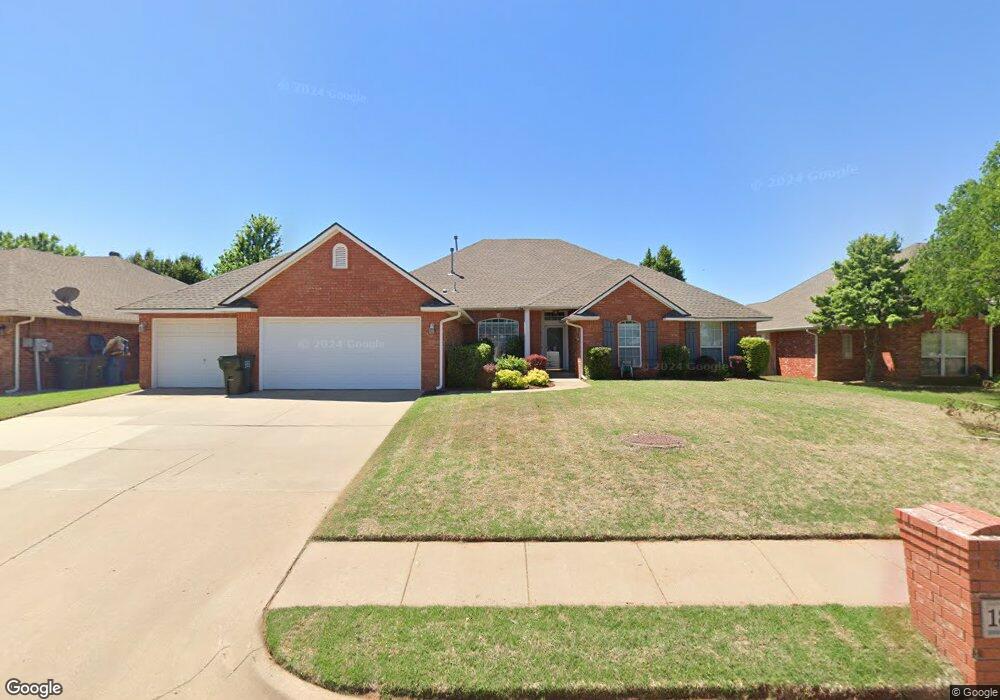
1821 Natchez Rd Edmond, OK 73012
Homestead NeighborhoodEstimated Value: $350,000 - $379,000
4
Beds
3
Baths
2,416
Sq Ft
$151/Sq Ft
Est. Value
About This Home
This home is located at 1821 Natchez Rd, Edmond, OK 73012 and is currently estimated at $365,106, approximately $151 per square foot. 1821 Natchez Rd is a home located in Oklahoma County with nearby schools including Frontier Elementary, Cheyenne Middle School, and North High School.
Ownership History
Date
Name
Owned For
Owner Type
Purchase Details
Closed on
Apr 19, 2007
Sold by
Elliott Jay M and Elliott Buffie L
Bought by
Lau Puong O and Ting Liang M
Current Estimated Value
Home Financials for this Owner
Home Financials are based on the most recent Mortgage that was taken out on this home.
Original Mortgage
$155,250
Outstanding Balance
$93,868
Interest Rate
6.15%
Mortgage Type
Purchase Money Mortgage
Estimated Equity
$271,238
Purchase Details
Closed on
Jul 31, 2002
Sold by
Cendant Mobility Government Financial Se
Bought by
Elliott Jay M and Elliott Buffie L
Purchase Details
Closed on
Jul 30, 2002
Sold by
Fuchs Brian P and Fuchs Joy J
Bought by
Cendant Mobility Government Financial Se
Purchase Details
Closed on
Mar 9, 2000
Sold by
Essex Corp
Bought by
Fuchs Brian P and Fuchs Joy J
Home Financials for this Owner
Home Financials are based on the most recent Mortgage that was taken out on this home.
Original Mortgage
$141,900
Interest Rate
8.12%
Create a Home Valuation Report for This Property
The Home Valuation Report is an in-depth analysis detailing your home's value as well as a comparison with similar homes in the area
Home Values in the Area
Average Home Value in this Area
Purchase History
| Date | Buyer | Sale Price | Title Company |
|---|---|---|---|
| Lau Puong O | $213,500 | American Guaranty Title Co | |
| Elliott Jay M | $96,000 | Stewart Abstract & Title | |
| Cendant Mobility Government Financial Se | $96,000 | Stewart Abstract & Title | |
| Fuchs Brian P | $180,000 | -- |
Source: Public Records
Mortgage History
| Date | Status | Borrower | Loan Amount |
|---|---|---|---|
| Open | Lau Puong O | $155,250 | |
| Previous Owner | Fuchs Brian P | $141,900 |
Source: Public Records
Tax History Compared to Growth
Tax History
| Year | Tax Paid | Tax Assessment Tax Assessment Total Assessment is a certain percentage of the fair market value that is determined by local assessors to be the total taxable value of land and additions on the property. | Land | Improvement |
|---|---|---|---|---|
| 2024 | $3,095 | $31,611 | $3,811 | $27,800 |
| 2023 | $3,095 | $30,690 | $3,862 | $26,828 |
| 2022 | $3,013 | $29,797 | $4,346 | $25,451 |
| 2021 | $2,909 | $28,930 | $4,741 | $24,189 |
| 2020 | $2,863 | $28,160 | $5,385 | $22,775 |
| 2019 | $2,824 | $27,665 | $5,385 | $22,280 |
| 2018 | $2,794 | $27,225 | $0 | $0 |
| 2017 | $2,822 | $27,609 | $5,385 | $22,224 |
| 2016 | $2,760 | $27,079 | $4,171 | $22,908 |
| 2015 | $2,673 | $26,290 | $4,160 | $22,130 |
| 2014 | $2,589 | $25,525 | $4,230 | $21,295 |
Source: Public Records
Map
Nearby Homes
- 1812 Natchez Rd
- 2904 Canton Ln
- 604 NW 197th St
- 19917 Rambling Creek Dr
- 2424 Semillon Way
- 2324 Merlot Ct
- 804 NW 193rd St
- 19504 Fieldshire Dr
- 821 NW 192nd Terrace
- 2713 Jills Trail
- 1212 Pine Valley
- 1233 Bradford Place
- 19608 Harness Ct
- 2605 Jills Trail
- 1117 NW 198th St
- 2708 Tanager Dr
- 2800 Tanager Dr
- 2700 Tanager Dr
- 1200 NW 199th St
- 1205 NW 199th St
- 1901 Natchez Rd
- 1817 Natchez Rd
- 19900 Millstone Crossing Dr
- 19904 Millstone Crossing Dr
- 1905 Natchez Rd
- 1813 Natchez Rd
- 19812 Millstone Crossing Dr
- 1816 Natchez Rd
- 1900 Natchez Rd
- 19908 Millstone Crossing Dr
- 1904 Natchez Rd
- 19912 Millstone Crossing Dr
- 1809 Natchez Rd
- 19808 Millstone Crossing Dr
- 19804 Millstone Crossing Dr
- 2917 Canton Ln
- 2905 Overland Way
- 1805 Natchez Rd
- 501 NW 198th St
- 2908 Overland Way