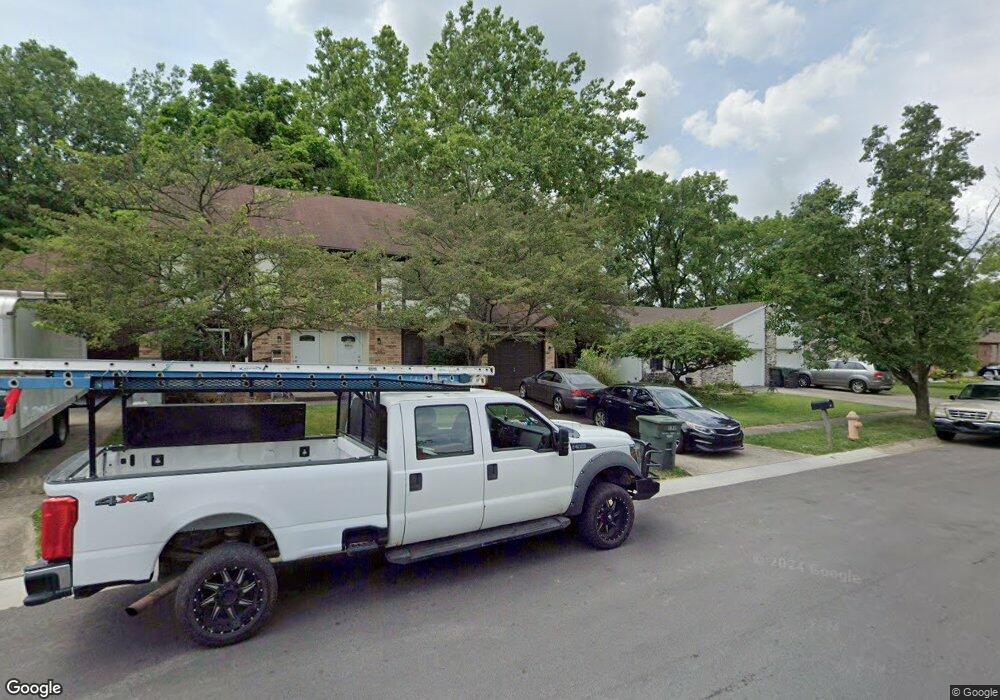
1821 Quarry Ridge Dr Unit 823 Columbus, OH 43232
Livingston-McNaughten NeighborhoodEstimated Value: $285,177 - $326,000
4
Beds
4
Baths
2,110
Sq Ft
$147/Sq Ft
Est. Value
About This Home
This home is located at 1821 Quarry Ridge Dr Unit 823, Columbus, OH 43232 and is currently estimated at $310,044, approximately $146 per square foot. 1821 Quarry Ridge Dr Unit 823 is a home located in Franklin County with nearby schools including Oakmont Elementary School, Yorktown Middle School, and Independence High School.
Ownership History
Date
Name
Owned For
Owner Type
Purchase Details
Closed on
Feb 14, 2020
Sold by
Pjm Rentals Llc
Bought by
Rnd Homes Llc
Current Estimated Value
Home Financials for this Owner
Home Financials are based on the most recent Mortgage that was taken out on this home.
Original Mortgage
$132,000
Outstanding Balance
$111,365
Interest Rate
3.72%
Mortgage Type
Future Advance Clause Open End Mortgage
Estimated Equity
$198,679
Purchase Details
Closed on
Sep 13, 2013
Sold by
Mckinley Pamela J
Bought by
Pjm Rentals Llc
Purchase Details
Closed on
Mar 26, 2005
Sold by
Mckinley James P and Mckinley Pamela J
Bought by
Mckinley Pamela J
Purchase Details
Closed on
Jul 7, 1994
Sold by
Willowbrook Investments
Bought by
Mckinley James P
Home Financials for this Owner
Home Financials are based on the most recent Mortgage that was taken out on this home.
Original Mortgage
$72,600
Interest Rate
8.61%
Mortgage Type
New Conventional
Create a Home Valuation Report for This Property
The Home Valuation Report is an in-depth analysis detailing your home's value as well as a comparison with similar homes in the area
Home Values in the Area
Average Home Value in this Area
Purchase History
| Date | Buyer | Sale Price | Title Company |
|---|---|---|---|
| Rnd Homes Llc | $165,000 | Northwest Title Box | |
| Pjm Rentals Llc | -- | None Available | |
| Mckinley Pamela J | -- | -- | |
| Mckinley James P | $487,410 | -- |
Source: Public Records
Mortgage History
| Date | Status | Borrower | Loan Amount |
|---|---|---|---|
| Open | Rnd Homes Llc | $132,000 | |
| Previous Owner | Mckinley James P | $72,600 |
Source: Public Records
Tax History Compared to Growth
Tax History
| Year | Tax Paid | Tax Assessment Tax Assessment Total Assessment is a certain percentage of the fair market value that is determined by local assessors to be the total taxable value of land and additions on the property. | Land | Improvement |
|---|---|---|---|---|
| 2024 | $3,763 | $82,110 | $21,070 | $61,040 |
| 2023 | $3,716 | $82,110 | $21,070 | $61,040 |
| 2022 | $3,151 | $59,300 | $30,280 | $29,020 |
| 2021 | $3,157 | $59,300 | $30,280 | $29,020 |
| 2020 | $3,162 | $59,300 | $30,280 | $29,020 |
| 2019 | $3,206 | $51,560 | $26,320 | $25,240 |
| 2018 | $3,134 | $51,560 | $26,320 | $25,240 |
| 2017 | $3,205 | $51,560 | $26,320 | $25,240 |
| 2016 | $3,370 | $49,600 | $11,590 | $38,010 |
| 2015 | $3,068 | $49,600 | $11,590 | $38,010 |
| 2014 | $3,075 | $49,600 | $11,590 | $38,010 |
| 2013 | $1,596 | $52,185 | $12,180 | $40,005 |
Source: Public Records
Map
Nearby Homes
- 1718 Sunapple Way
- 1591 Stephanie Ct Unit 15912
- 5596 Autumn Chase Dr
- 1930 Walnut Hill Park Dr
- 5846 Riverton Rd
- 0 Radekin Rd Unit 225029852
- 1942 Bairsford Dr Unit 944
- 1835 Woodette Rd
- 1314 Yorkland Rd Unit C
- 1759 Lonsdale Rd
- 6156 Roselawn Ave
- 5366 Yorkshire Village Ln Unit B-22
- 0 Brice Rd
- 5337 Ivyhurst Dr
- 1616 Coppertree Rd Unit 1615
- 6348 E Livingston Ave
- 6424-6426 Birchview Dr N
- 1945 Riverdale Rd
- 1818 Lucks Rd
- 2293 Ayers Dr
- 1811 Quarry Ridge Dr Unit 813
- 1835 Quarry Ridge Dr Unit 837
- 1797 Quarry Ridge Dr Unit A
- 1795 Quarry Ridge Dr Unit 1B
- 5946 Rock Glen Ct
- 1800-1802 Quarry Ridge Dr
- 1800 Quarry Ridge Dr Unit 802
- 1800 Quarry Ridge Dr
- 5933 Little Brook Way
- 1783 Quarry Ridge Dr
- 5953-55 Rock Glen Ct
- 1788 Quarry Ridge Dr Unit 790
- 5954 Rock Glen Ct Unit 956
- 5953 Rock Glen Ct Unit 955
- 5953-5955 Rock Glen Ct
- 1782 Quarry Ridge Dr
- 5921 Little Brook Way Unit 923
- 5963 Little Brook Way Unit 965
- 5965 Little Brook Way
- 0 Little Brook Way Unit 8 2210025