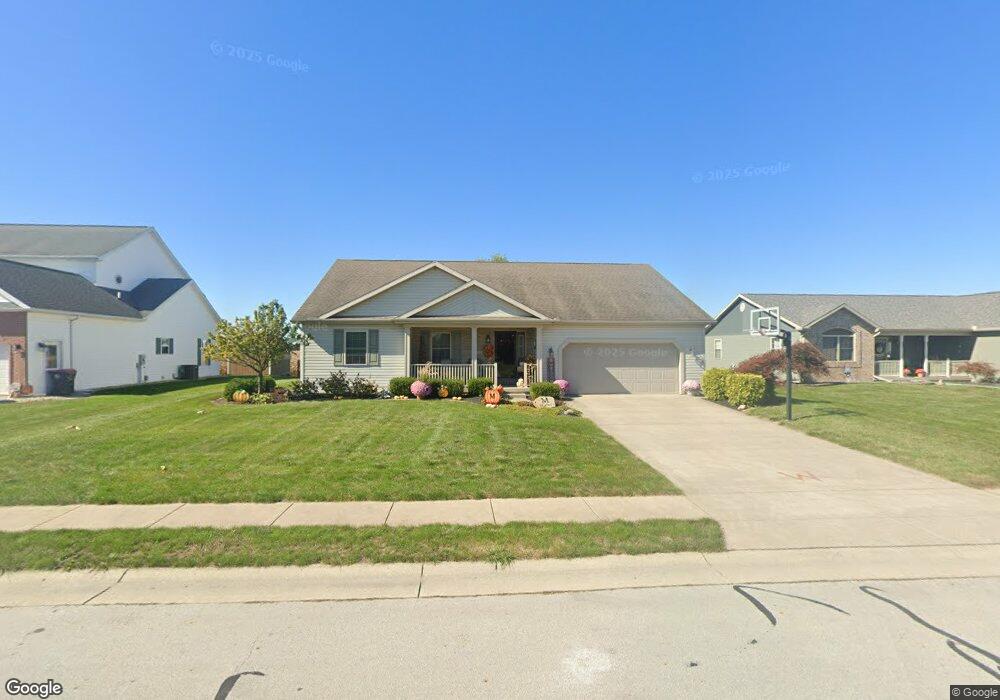
1821 Rosewood Dr Wapakoneta, OH 45895
Estimated Value: $314,000 - $392,000
3
Beds
3
Baths
1,741
Sq Ft
$202/Sq Ft
Est. Value
About This Home
This home is located at 1821 Rosewood Dr, Wapakoneta, OH 45895 and is currently estimated at $350,969, approximately $201 per square foot. 1821 Rosewood Dr is a home located in Auglaize County with nearby schools including Wapakoneta Elementary School, Wapakoneta High School, and Wapakoneta Middle School.
Ownership History
Date
Name
Owned For
Owner Type
Purchase Details
Closed on
Aug 29, 2019
Sold by
Chaub Christopher L and Schaub Nichole L
Bought by
Mielke Karl V and Mielke Nedra S
Current Estimated Value
Purchase Details
Closed on
Jul 24, 2008
Sold by
Hud
Bought by
Schaub Christopher L and Schaub Nichole L
Purchase Details
Closed on
May 3, 2007
Sold by
Pendergast Michael and Regions Bank
Bought by
Hud
Purchase Details
Closed on
May 18, 2005
Sold by
Schlenker Development Llc
Bought by
Apollo Ventures Inc
Home Financials for this Owner
Home Financials are based on the most recent Mortgage that was taken out on this home.
Original Mortgage
$128,000
Interest Rate
6.05%
Mortgage Type
Construction
Create a Home Valuation Report for This Property
The Home Valuation Report is an in-depth analysis detailing your home's value as well as a comparison with similar homes in the area
Home Values in the Area
Average Home Value in this Area
Purchase History
| Date | Buyer | Sale Price | Title Company |
|---|---|---|---|
| Mielke Karl V | $259,000 | None Available | |
| Schaub Christopher L | $87,000 | Lakeside Title & Escrow Agen | |
| Hud | $165,000 | None Available | |
| Apollo Ventures Inc | $5,375 | None Available |
Source: Public Records
Mortgage History
| Date | Status | Borrower | Loan Amount |
|---|---|---|---|
| Previous Owner | Apollo Ventures Inc | $128,000 |
Source: Public Records
Tax History Compared to Growth
Tax History
| Year | Tax Paid | Tax Assessment Tax Assessment Total Assessment is a certain percentage of the fair market value that is determined by local assessors to be the total taxable value of land and additions on the property. | Land | Improvement |
|---|---|---|---|---|
| 2024 | $4,300 | $88,200 | $13,700 | $74,500 |
| 2023 | $2,869 | $88,200 | $13,700 | $74,500 |
| 2022 | $2,447 | $69,930 | $11,910 | $58,020 |
| 2021 | $2,427 | $69,930 | $11,910 | $58,020 |
| 2020 | $1,227 | $69,934 | $11,914 | $58,020 |
| 2019 | $2,078 | $57,323 | $9,765 | $47,558 |
| 2018 | $2,110 | $57,323 | $9,765 | $47,558 |
| 2017 | $2,074 | $57,323 | $9,765 | $47,558 |
| 2016 | $1,936 | $53,666 | $9,300 | $44,366 |
| 2015 | $1,910 | $53,666 | $9,300 | $44,366 |
| 2014 | $1,930 | $53,666 | $9,300 | $44,366 |
| 2013 | $1,964 | $53,666 | $9,300 | $44,366 |
Source: Public Records
Map
Nearby Homes
- 0 Wapakoneta Cridersville Rd
- 322 Cole Dr
- 808 Aster Dr
- 420 Hoopengarner St
- 17054 State Route 198
- 920 Primrose Dr
- 1028 Stonegate Ct
- 906 Aster Dr
- 1020 Timber Trail
- 924 Poppy Dr
- 601 Warren St
- 9 E Silver St
- 0 Ohio 67
- 414 W Auglaize St
- 307 W Auglaize St
- 106 Valleyview Dr
- 17092 Hauss Rd
- 608 W Benton St
- 201 E Pearl St
- 211 W Benton St