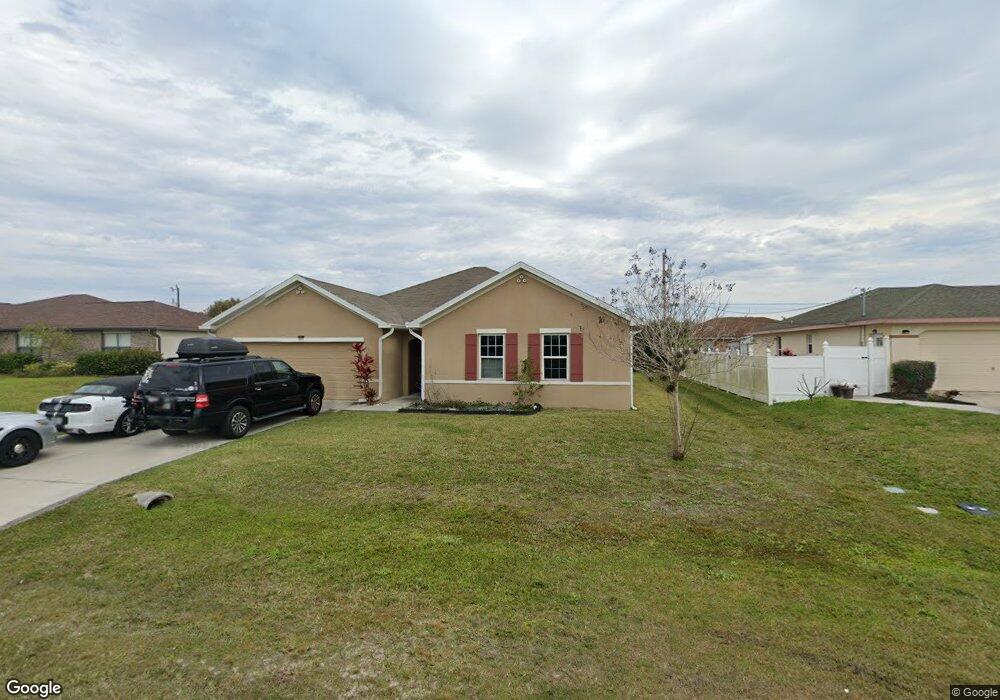
1821 SW 4th Ave Cape Coral, FL 33991
Hancock NeighborhoodEstimated Value: $298,000 - $373,000
3
Beds
2
Baths
1,607
Sq Ft
$208/Sq Ft
Est. Value
About This Home
This home is located at 1821 SW 4th Ave, Cape Coral, FL 33991 and is currently estimated at $334,705, approximately $208 per square foot. 1821 SW 4th Ave is a home located in Lee County with nearby schools including Caloosa Elementary School, Cape Elementary School, and Tropic Isles Elementary School.
Ownership History
Date
Name
Owned For
Owner Type
Purchase Details
Closed on
Jun 28, 2016
Sold by
Corona Property Holdings Llc
Bought by
Smith Jermaine D and Etienne Marie
Current Estimated Value
Home Financials for this Owner
Home Financials are based on the most recent Mortgage that was taken out on this home.
Original Mortgage
$152,000
Outstanding Balance
$118,679
Interest Rate
3%
Mortgage Type
Adjustable Rate Mortgage/ARM
Estimated Equity
$216,026
Purchase Details
Closed on
Jul 28, 2009
Sold by
Gmac Mortgage Llc
Bought by
Corona Property Holdings Llc
Purchase Details
Closed on
Jun 29, 2009
Sold by
Mcjunkin Frank S
Bought by
Gmac Mortgage Llc
Purchase Details
Closed on
Jun 14, 2002
Sold by
Seller Allan B
Bought by
Mcjunkin Frank S and Mcjunkin Maribel E
Home Financials for this Owner
Home Financials are based on the most recent Mortgage that was taken out on this home.
Original Mortgage
$116,000
Interest Rate
6.77%
Create a Home Valuation Report for This Property
The Home Valuation Report is an in-depth analysis detailing your home's value as well as a comparison with similar homes in the area
Home Values in the Area
Average Home Value in this Area
Purchase History
| Date | Buyer | Sale Price | Title Company |
|---|---|---|---|
| Smith Jermaine D | $161,000 | Realty Title Solutions Lllp | |
| Corona Property Holdings Llc | $74,900 | Attorney | |
| Gmac Mortgage Llc | $223,900 | Attorney | |
| Mcjunkin Frank S | $5,700 | -- |
Source: Public Records
Mortgage History
| Date | Status | Borrower | Loan Amount |
|---|---|---|---|
| Open | Smith Jermaine D | $152,000 | |
| Previous Owner | Mcjunkin Frank S | $116,000 |
Source: Public Records
Tax History Compared to Growth
Tax History
| Year | Tax Paid | Tax Assessment Tax Assessment Total Assessment is a certain percentage of the fair market value that is determined by local assessors to be the total taxable value of land and additions on the property. | Land | Improvement |
|---|---|---|---|---|
| 2025 | $3,751 | $171,486 | -- | -- |
| 2024 | $3,649 | $166,653 | -- | -- |
| 2023 | $3,649 | $161,799 | $0 | $0 |
| 2022 | $3,453 | $157,086 | $0 | $0 |
| 2021 | $3,477 | $178,617 | $36,004 | $142,613 |
| 2020 | $3,440 | $150,405 | $0 | $0 |
| 2019 | $3,366 | $147,023 | $0 | $0 |
| 2018 | $3,355 | $144,282 | $0 | $0 |
| 2017 | $3,326 | $141,314 | $12,000 | $129,314 |
| 2016 | $3,651 | $126,578 | $12,000 | $114,578 |
| 2015 | $3,469 | $113,092 | $9,500 | $103,592 |
| 2014 | -- | $102,408 | $6,580 | $95,828 |
| 2013 | -- | $90,503 | $4,800 | $85,703 |
Source: Public Records
Map
Nearby Homes
- 1816 SW 3rd Place
- 1825 SW 3rd Place
- 411 SW 19th Terrace
- 1817 SW 3rd Ave
- 213 SW 19th Terrace
- 212 SW 19th Terrace
- 446 SW 19th Terrace
- 1741 Emerald Cove Cir
- 442 SW 19th Ln
- 1221 SW 3rd Ave
- 1624 SW 4th St
- 216 SW 20th St
- 128 SW 19th Ln
- 217 SW 17th St
- 217 SW 21st St
- 232 SW 21st St
- 421 SW 21st Terrace
- 1813 SW 1st Ave
- 1711 SW 6th Ave
- 427 SW 21st Terrace
- 1817 SW 4th Ave
- 1825 SW 4th Ave
- 1820 SW 3rd Place
- 1824 SW 3rd Place
- 1813 SW 4th Ave
- 1829 SW 4th Ave
- 1818 SW 4th Ave
- 1824 SW 4th Ave
- 1812 SW 3rd Place
- 1828 SW 3rd Place
- 1814 SW 4th Ave
- 1809 SW 4th Ave
- 1828 SW 4th Ave
- 1812 SW 4th Ave
- 1808 SW 3rd Place
- 1821 SW 3rd Place
- 1821 SW 4th Place
- 1817 SW 3rd Place
- 1805 SW 4th Ave
- 1825 SW 4th Place