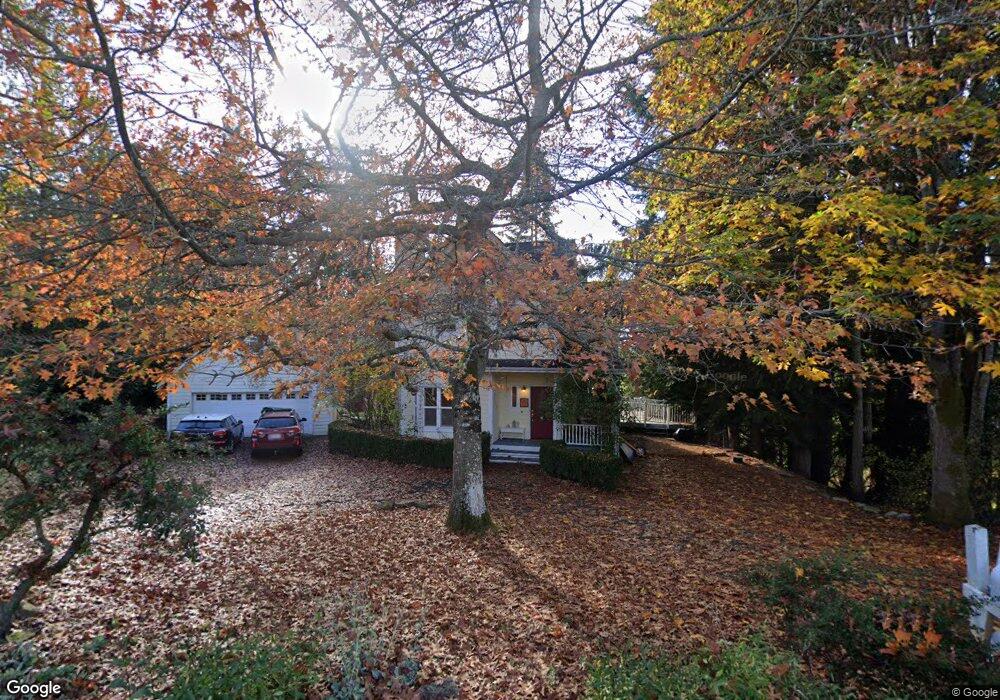
1821 Virginia Ct NE Bainbridge Island, WA 98110
Estimated Value: $914,000 - $1,043,288
3
Beds
2
Baths
1,454
Sq Ft
$674/Sq Ft
Est. Value
About This Home
This home is located at 1821 Virginia Ct NE, Bainbridge Island, WA 98110 and is currently estimated at $979,322, approximately $673 per square foot. 1821 Virginia Ct NE is a home located in Kitsap County with nearby schools including Bainbridge High School, Carden Country School, and Hyla School.
Ownership History
Date
Name
Owned For
Owner Type
Purchase Details
Closed on
Feb 4, 2002
Sold by
Borders Brett W and Borders Tina D
Bought by
Hurme Peter and Huddleson Tracy J
Current Estimated Value
Home Financials for this Owner
Home Financials are based on the most recent Mortgage that was taken out on this home.
Original Mortgage
$228,000
Outstanding Balance
$95,008
Interest Rate
7.17%
Estimated Equity
$884,314
Purchase Details
Closed on
May 17, 1995
Sold by
Hupp Lizanne and Garlid Jeff
Bought by
Borders Brett W and Borders Tina D
Home Financials for this Owner
Home Financials are based on the most recent Mortgage that was taken out on this home.
Original Mortgage
$32,500
Interest Rate
8.51%
Mortgage Type
Seller Take Back
Create a Home Valuation Report for This Property
The Home Valuation Report is an in-depth analysis detailing your home's value as well as a comparison with similar homes in the area
Home Values in the Area
Average Home Value in this Area
Purchase History
| Date | Buyer | Sale Price | Title Company |
|---|---|---|---|
| Hurme Peter | $285,000 | First American Title Ins | |
| Borders Brett W | $39,500 | Stewart Title Co |
Source: Public Records
Mortgage History
| Date | Status | Borrower | Loan Amount |
|---|---|---|---|
| Open | Hurme Peter | $228,000 | |
| Previous Owner | Borders Brett W | $32,500 |
Source: Public Records
Tax History Compared to Growth
Tax History
| Year | Tax Paid | Tax Assessment Tax Assessment Total Assessment is a certain percentage of the fair market value that is determined by local assessors to be the total taxable value of land and additions on the property. | Land | Improvement |
|---|---|---|---|---|
| 2026 | $6,854 | $838,930 | $305,930 | $533,000 |
| 2025 | $6,854 | $838,930 | $305,930 | $533,000 |
| 2024 | $6,551 | $838,930 | $305,930 | $533,000 |
| 2023 | $6,831 | $838,930 | $305,930 | $533,000 |
| 2022 | $6,182 | $646,200 | $245,930 | $400,270 |
| 2021 | $5,675 | $564,530 | $213,650 | $350,880 |
| 2020 | $5,750 | $564,530 | $213,650 | $350,880 |
| 2019 | $5,367 | $536,760 | $201,210 | $335,550 |
| 2018 | $5,265 | $411,340 | $152,440 | $258,900 |
| 2017 | $4,352 | $411,340 | $152,440 | $258,900 |
| 2016 | $4,146 | $372,530 | $155,860 | $216,670 |
| 2015 | $3,595 | $327,990 | $136,100 | $191,890 |
| 2014 | -- | $327,990 | $136,100 | $191,890 |
| 2013 | -- | $327,990 | $136,100 | $191,890 |
Source: Public Records
Map
Nearby Homes
- 0 Lot 9 Park View Dr NE
- 0 Devenny Ave NE Unit NWM2324546
- 1574 Park View Dr NE Unit 1
- 0 Mardell (Lot 12) Ct Unit NWM1856638
- 0 Mardell (Lot 11) Ct Unit NWM1856637
- 0 Mardell (Lot 6) Ct Unit NWM1768026
- 0 Mardell (Lot 7) Ct Unit 1759157
- 2372 Douglas Dr NE
- 9551 NE South Beach Dr Unit 3G
- 9889 NE South Beach Dr
- 9721 NE Charisma Cir
- 11121 NE Brownell Ln
- 1850 Beans Bight Rd NE
- 8609 E Caraway Rd
- 8623 E Caraway Rd
- 6069 Watauga Beach Dr E
- 8471 E Caraway Rd
- 4290 Rockaway Beach Rd NE
- 4740 NE Rose Ave NE
- 7569 E Montana St
- 1766 Parkview Dr NE
- 1810 Parkview Dr NE
- 23 ,24 Virginia Ct NE
- 1815 Virginia Ct NE
- 1854 Parkview Dr NE
- 1843 Virginia Ct NE
- 1842 Virginia Ct NE
- 1870 Parkview Dr NE
- 1828 Virginia Ct NE
- 1730 Parkview Dr NE
- 1882 Parkview Dr NE
- 1849 Virginia Ct NE
- 1807 Virginia Ct NE
- 9725 NE Hilltop Dr
- 1815 Parkview Dr NE
- 1741 Parkview Dr NE
- 1843 Parkview Dr NE
- 1912 NE Park View Dr
- 1733 Parkview Dr NE
- 1861 Parkview Dr NE