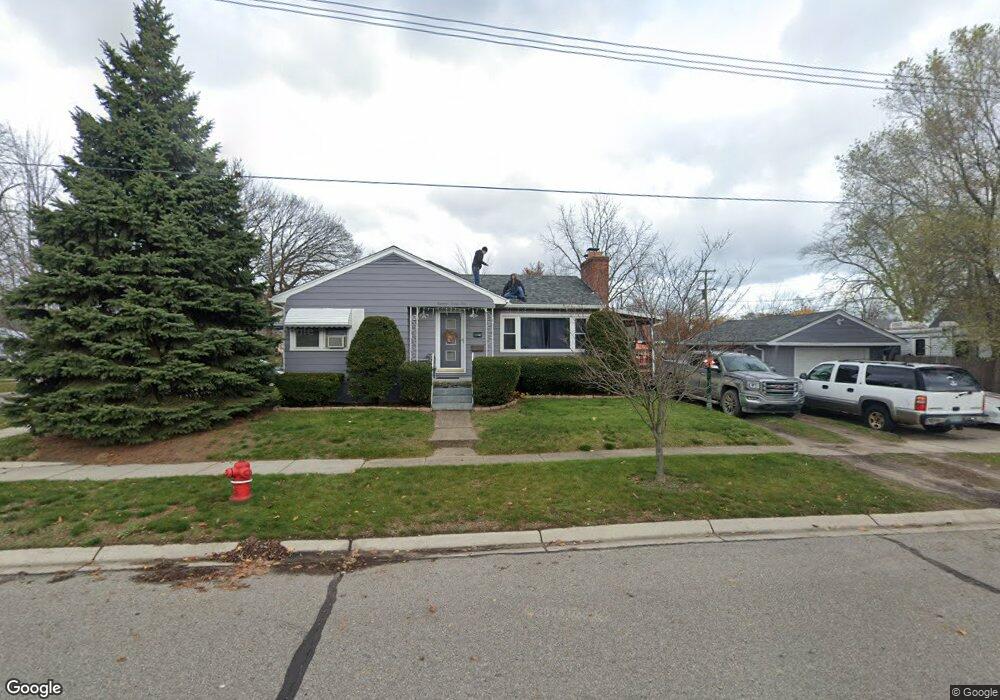
1821 White St Port Huron, MI 48060
Estimated Value: $90,000 - $156,780
2
Beds
2
Baths
950
Sq Ft
$130/Sq Ft
Est. Value
About This Home
This home is located at 1821 White St, Port Huron, MI 48060 and is currently estimated at $123,445, approximately $129 per square foot. 1821 White St is a home located in St. Clair County with nearby schools including Michigamme Elementary School, Central Middle School, and Port Huron High School.
Ownership History
Date
Name
Owned For
Owner Type
Purchase Details
Closed on
Apr 28, 2025
Sold by
Bodeis Stephanie L
Bought by
Eastpointe Capitol Investments Llc
Current Estimated Value
Purchase Details
Closed on
Nov 1, 2012
Sold by
Bodeis Stephanie L
Bought by
Eastpointe Capitol Investments Llc
Purchase Details
Closed on
Sep 2, 2008
Sold by
Maritime Capitol Investments Llc
Bought by
Bodeis Stephanie L
Purchase Details
Closed on
Jun 24, 2008
Sold by
Turner Brian L and Turner Carrie L
Bought by
Maritime Capitol Investments Llc
Create a Home Valuation Report for This Property
The Home Valuation Report is an in-depth analysis detailing your home's value as well as a comparison with similar homes in the area
Home Values in the Area
Average Home Value in this Area
Purchase History
| Date | Buyer | Sale Price | Title Company |
|---|---|---|---|
| Eastpointe Capitol Investments Llc | $95,000 | None Listed On Document | |
| Eastpointe Capitol Investments Llc | $95,000 | None Listed On Document | |
| Eastpointe Capitol Investments Llc | -- | First American Title Ins Co | |
| Bodeis Stephanie L | -- | None Available | |
| Maritime Capitol Investments Llc | $95,000 | None Available |
Source: Public Records
Tax History Compared to Growth
Tax History
| Year | Tax Paid | Tax Assessment Tax Assessment Total Assessment is a certain percentage of the fair market value that is determined by local assessors to be the total taxable value of land and additions on the property. | Land | Improvement |
|---|---|---|---|---|
| 2025 | $2,552 | $74,100 | $0 | $0 |
| 2024 | $2,260 | $72,300 | $0 | $0 |
| 2023 | $2,147 | $65,700 | $0 | $0 |
| 2022 | $2,161 | $57,600 | $0 | $0 |
| 2021 | $2,068 | $57,700 | $0 | $0 |
| 2020 | $2,026 | $52,400 | $52,400 | $0 |
| 2019 | $1,996 | $37,600 | $0 | $0 |
| 2018 | $2,751 | $37,600 | $0 | $0 |
| 2017 | $1,779 | $32,500 | $0 | $0 |
| 2016 | $1,908 | $32,500 | $0 | $0 |
| 2015 | $1,561 | $29,300 | $29,300 | $0 |
| 2014 | $1,561 | $28,100 | $28,100 | $0 |
| 2013 | -- | $27,800 | $0 | $0 |
Source: Public Records
Map
Nearby Homes