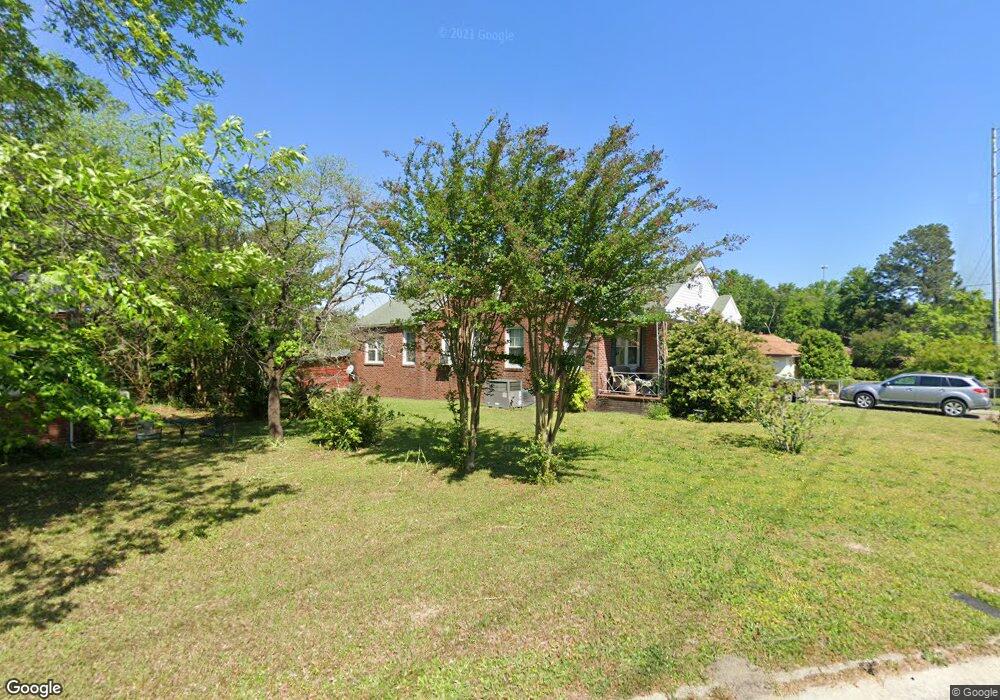
1821 Wilkinson Cir Augusta, GA 30904
Albion Acres NeighborhoodEstimated Value: $128,000 - $155,087
2
Beds
2
Baths
1,450
Sq Ft
$98/Sq Ft
Est. Value
About This Home
This home is located at 1821 Wilkinson Cir, Augusta, GA 30904 and is currently estimated at $142,272, approximately $98 per square foot. 1821 Wilkinson Cir is a home located in Richmond County with nearby schools including Bayvale Elementary School, Murphey Middle School, and Johnson Magnet.
Ownership History
Date
Name
Owned For
Owner Type
Purchase Details
Closed on
Dec 6, 2023
Sold by
Carlson Richard
Bought by
Carlson Richard and Filatova Alla
Current Estimated Value
Purchase Details
Closed on
May 3, 2006
Sold by
Johnson Lamar
Bought by
Carlson Richard
Home Financials for this Owner
Home Financials are based on the most recent Mortgage that was taken out on this home.
Original Mortgage
$70,000
Interest Rate
6.28%
Mortgage Type
Fannie Mae Freddie Mac
Purchase Details
Closed on
Jun 13, 2002
Sold by
Ogilvie Mariann
Bought by
Johnson Lamar
Home Financials for this Owner
Home Financials are based on the most recent Mortgage that was taken out on this home.
Original Mortgage
$37,000
Interest Rate
6.67%
Mortgage Type
Seller Take Back
Purchase Details
Closed on
Nov 22, 1999
Sold by
Ogilvie Forest
Bought by
Ogilvie Mariann
Create a Home Valuation Report for This Property
The Home Valuation Report is an in-depth analysis detailing your home's value as well as a comparison with similar homes in the area
Home Values in the Area
Average Home Value in this Area
Purchase History
| Date | Buyer | Sale Price | Title Company |
|---|---|---|---|
| Carlson Richard | -- | -- | |
| Carlson Richard | $70,000 | None Available | |
| Johnson Lamar | $38,900 | -- | |
| Johnson Lamar | $38,900 | -- | |
| Ogilvie Mariann | -- | -- |
Source: Public Records
Mortgage History
| Date | Status | Borrower | Loan Amount |
|---|---|---|---|
| Previous Owner | Carlson Richard | $70,000 | |
| Previous Owner | Carlson Richard | $0 | |
| Previous Owner | Johnson Lamar | $37,000 |
Source: Public Records
Tax History
| Year | Tax Paid | Tax Assessment Tax Assessment Total Assessment is a certain percentage of the fair market value that is determined by local assessors to be the total taxable value of land and additions on the property. | Land | Improvement |
|---|---|---|---|---|
| 2025 | $1,871 | $57,136 | $3,016 | $54,120 |
| 2024 | $1,871 | $55,360 | $3,016 | $52,344 |
| 2023 | $963 | $45,184 | $3,016 | $42,168 |
| 2022 | $1,089 | $29,764 | $3,016 | $26,748 |
| 2021 | $1,116 | $28,442 | $3,018 | $25,424 |
| 2020 | $1,102 | $28,442 | $3,018 | $25,424 |
| 2019 | $1,154 | $28,442 | $3,018 | $25,424 |
| 2018 | $1,160 | $28,442 | $3,018 | $25,424 |
| 2017 | $1,104 | $28,442 | $3,018 | $25,424 |
| 2016 | $1,105 | $28,442 | $3,018 | $25,424 |
| 2015 | $1,065 | $27,014 | $3,018 | $23,996 |
| 2014 | $1,066 | $27,014 | $3,018 | $23,996 |
Source: Public Records
Map
Nearby Homes
- 2242 Wheeless Rd
- 3011 Storey Dr
- 2349 Wheeless Rd
- 1927 Hopie Rd
- 2313 Ridge Rd
- 2235 Sibley Rd
- 2344 Dorn Rd
- 2372 Courtney Cir
- 2145 Hillsinger Rd
- 2404 Jennings Rd
- 2320 Mimosa Dr
- 2324 Mimosa Dr
- 3024 Sprucewood Dr
- 2717 Pine Valley Rd
- 2391 Wheeless Rd
- 2835 Fairmont St
- 3015 Thomas Ln
- 2149 NW Veterans Dr
- 2393 Wheeless Rd
- 2718 Lakewood Dr
- 1823 Wilkinson Cir
- 1819 Wilkinson Cir
- 1825 Wilkinson Cir
- 1817 Wilkinson Cir
- 1824 Wilkinson Cir
- 1820 Wilkinson Cir
- 1815 Wilkinson Cir
- 1827 Wilkinson Cir
- 1818 Wilkinson Cir
- 1822 Wilkinson Cir
- 1816 Wilkinson Cir
- 1813 Wilkinson Cir
- 1829 Wilkinson Cir
- 1829 1/2 Wilkinson Cir
- 1829 Wilkinson Cir
- 1814 Wilkinson Cir
- 1826 Wilkinson Cir
- 1812 Wilkinson Cir
- 1811 Wilkinson Cir
- 3029 Milledgeville Rd
Your Personal Tour Guide
Ask me questions while you tour the home.