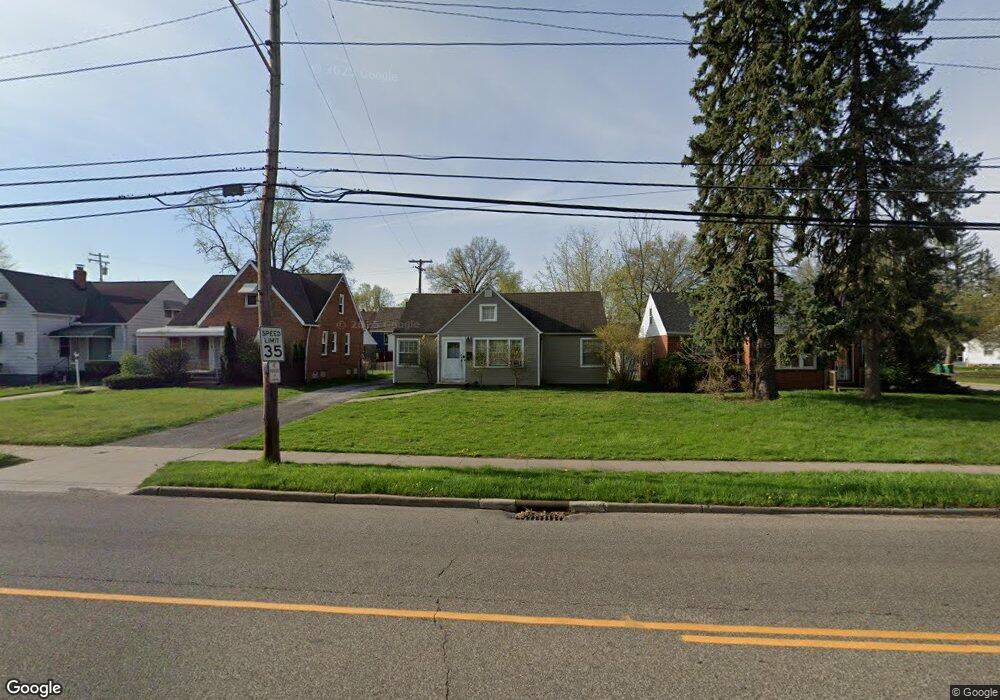
18210 Libby Rd Maple Heights, OH 44137
Estimated Value: $104,000 - $143,000
3
Beds
1
Bath
1,044
Sq Ft
$113/Sq Ft
Est. Value
About This Home
This home is located at 18210 Libby Rd, Maple Heights, OH 44137 and is currently estimated at $118,362, approximately $113 per square foot. 18210 Libby Rd is a home located in Cuyahoga County with nearby schools including Abraham Lincoln Elementary School, Rockside/ J.F. Kennedy School, and Barack Obama School.
Ownership History
Date
Name
Owned For
Owner Type
Purchase Details
Closed on
Dec 28, 2016
Sold by
Potocar Robert
Bought by
Potocar Residential and Potocar Robert
Current Estimated Value
Purchase Details
Closed on
May 24, 2010
Sold by
Federal Home Loan Mortgage Corporation
Bought by
Potocar Robert
Purchase Details
Closed on
Feb 22, 2010
Sold by
Lembo David F
Bought by
Federal Home Loan Mortgage Corp
Purchase Details
Closed on
May 18, 2000
Sold by
Kalista Jamie
Bought by
Lembo David
Purchase Details
Closed on
Apr 7, 2000
Sold by
Wardle William D
Bought by
Kalista Jamie
Purchase Details
Closed on
Apr 2, 1985
Sold by
Wardle William D
Bought by
Wardle William D and Wardle Josephine
Purchase Details
Closed on
Dec 12, 1978
Sold by
Laslo John and Laslo Theresa C
Bought by
Wardle William D
Purchase Details
Closed on
Jan 1, 1975
Bought by
Laslo John and Laslo Theresa C
Create a Home Valuation Report for This Property
The Home Valuation Report is an in-depth analysis detailing your home's value as well as a comparison with similar homes in the area
Home Values in the Area
Average Home Value in this Area
Purchase History
| Date | Buyer | Sale Price | Title Company |
|---|---|---|---|
| Potocar Residential | -- | None Available | |
| Potocar Robert | -- | Attorney | |
| Federal Home Loan Mortgage Corp | $26,667 | None Available | |
| Lembo David | $57,000 | Title First Agency Inc | |
| Kalista Jamie | $47,500 | Midland Title Security Inc | |
| Wardle William D | -- | -- | |
| Wardle William D | $41,000 | -- | |
| Laslo John | -- | -- |
Source: Public Records
Tax History
| Year | Tax Paid | Tax Assessment Tax Assessment Total Assessment is a certain percentage of the fair market value that is determined by local assessors to be the total taxable value of land and additions on the property. | Land | Improvement |
|---|---|---|---|---|
| 2025 | $2,263 | $25,305 | $6,265 | $19,040 |
| 2024 | $2,498 | $25,305 | $6,265 | $19,040 |
| 2023 | $2,464 | $22,120 | $5,040 | $17,080 |
| 2022 | $2,455 | $22,120 | $5,040 | $17,080 |
| 2021 | $2,616 | $22,120 | $5,040 | $17,080 |
| 2020 | $2,242 | $16,770 | $3,820 | $12,950 |
| 2019 | $2,228 | $47,900 | $10,900 | $37,000 |
| 2018 | $2,216 | $16,770 | $3,820 | $12,950 |
| 2017 | $2,258 | $16,770 | $4,970 | $11,800 |
| 2016 | $2,182 | $16,770 | $4,970 | $11,800 |
| 2015 | $2,092 | $16,770 | $4,970 | $11,800 |
| 2014 | $2,182 | $18,410 | $5,460 | $12,950 |
Source: Public Records
Map
Nearby Homes
- 5234 Erwin St
- 5177 Cato St
- 18715 Libby Rd
- 5150 Arch St
- 5231 Philip Ave
- 5341 Hollywood Ave
- 5127 Erwin St
- 5246 Philip Ave
- 18909 Maple Heights Blvd
- 5100 Erwin St
- 5408 Oakwood Ave
- 5194 Homewood Ave
- 17409 Mapleboro Ave
- 18840 Nitra Ave
- 18217 Edinboro Ave
- 18851 Raymond St
- 18990 Raymond St
- 5031 Cato St
- 5165 Camden Rd
- 5481 Dalewood Ave
- 18214 Libby Rd
- 18204 Libby Rd
- 18218 Libby Rd
- 18209 Highland Dr
- 18203 Highland Dr
- 18215 Highland Dr
- 18222 Libby Rd
- 18219 Highland Dr
- 18226 Libby Rd
- 18303 Highland Dr
- 18118 Libby Rd
- 18307 Highland Dr
- 18211 Libby Rd
- 18205 Libby Rd
- 18217 Libby Rd
- 18201 Libby Rd
- 5290 South Blvd
- 18311 Highland Dr
- 5331 South Blvd
- 18114 Libby Rd
Your Personal Tour Guide
Ask me questions while you tour the home.