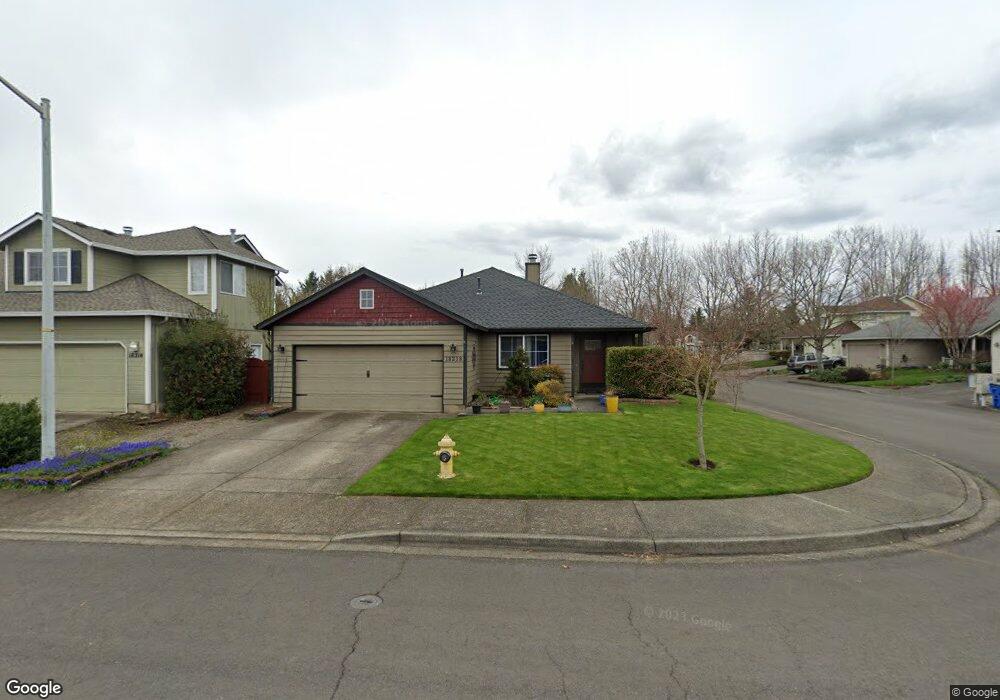
18218 SE 18th Way Vancouver, WA 98683
Fisher's Landing East NeighborhoodEstimated Value: $487,000 - $536,000
3
Beds
2
Baths
1,274
Sq Ft
$395/Sq Ft
Est. Value
About This Home
This home is located at 18218 SE 18th Way, Vancouver, WA 98683 and is currently estimated at $502,983, approximately $394 per square foot. 18218 SE 18th Way is a home located in Clark County with nearby schools including Illahee Elementary School, Shahala Middle School, and Union High School.
Ownership History
Date
Name
Owned For
Owner Type
Purchase Details
Closed on
Apr 19, 2018
Sold by
Miklja Terri and Jacobsen Peter K
Bought by
Robinson Terri R
Current Estimated Value
Home Financials for this Owner
Home Financials are based on the most recent Mortgage that was taken out on this home.
Original Mortgage
$319,113
Outstanding Balance
$277,115
Interest Rate
4.87%
Mortgage Type
FHA
Estimated Equity
$225,869
Purchase Details
Closed on
Jun 30, 2006
Sold by
Miklja Marinel
Bought by
Miklja Terri
Home Financials for this Owner
Home Financials are based on the most recent Mortgage that was taken out on this home.
Original Mortgage
$191,920
Interest Rate
6.12%
Mortgage Type
Purchase Money Mortgage
Purchase Details
Closed on
Jun 29, 2006
Sold by
Mickelson Philip A and Mickelson Rana
Bought by
Miklja Terri
Home Financials for this Owner
Home Financials are based on the most recent Mortgage that was taken out on this home.
Original Mortgage
$191,920
Interest Rate
6.12%
Mortgage Type
Purchase Money Mortgage
Purchase Details
Closed on
Mar 25, 2000
Sold by
Cornelsen Kevin E and Cornelsen Jo Lyn
Bought by
Mickelson Philip A and Mickelson Rana
Home Financials for this Owner
Home Financials are based on the most recent Mortgage that was taken out on this home.
Original Mortgage
$133,000
Interest Rate
8.5%
Mortgage Type
Seller Take Back
Purchase Details
Closed on
Feb 23, 2000
Sold by
Va
Bought by
Cornelsen Kevin E and Cornelsen Jo Lyn
Home Financials for this Owner
Home Financials are based on the most recent Mortgage that was taken out on this home.
Original Mortgage
$133,000
Interest Rate
8.5%
Mortgage Type
Seller Take Back
Purchase Details
Closed on
Dec 9, 1999
Sold by
First Nationwide Mtg Corp
Bought by
Va
Purchase Details
Closed on
Nov 22, 1999
Sold by
Beeler Donald L and Beeler Keiko
Bought by
First Nationwide Mtg Corp
Purchase Details
Closed on
Jun 9, 1997
Sold by
Stonebrook Homes Inc
Bought by
Beeler Donald L and Beeler Keiko
Home Financials for this Owner
Home Financials are based on the most recent Mortgage that was taken out on this home.
Original Mortgage
$125,546
Interest Rate
7.98%
Mortgage Type
VA
Purchase Details
Closed on
Jan 10, 1997
Sold by
The Newland Group Inc
Bought by
Stonebrook Homes Inc
Create a Home Valuation Report for This Property
The Home Valuation Report is an in-depth analysis detailing your home's value as well as a comparison with similar homes in the area
Home Values in the Area
Average Home Value in this Area
Purchase History
| Date | Buyer | Sale Price | Title Company |
|---|---|---|---|
| Robinson Terri R | $325,000 | Chicago Title Fishsers Landi | |
| Miklja Terri | -- | Fidelity National Title | |
| Miklja Terri | $239,900 | Fidelity National Title | |
| Mickelson Philip A | -- | Chicago Title Insurance | |
| Mickelson Phillip | $139,000 | Stewart Title | |
| Cornelsen Kevin E | -- | Chicago Title Insurance Co | |
| Va | -- | Chicago Title | |
| First Nationwide Mtg Corp | $112,684 | Transnation Title Insurance | |
| Beeler Donald L | $123,084 | Chicago Title Insurance Co | |
| Stonebrook Homes Inc | $33,564 | First American Title Co |
Source: Public Records
Mortgage History
| Date | Status | Borrower | Loan Amount |
|---|---|---|---|
| Open | Robinson Terri R | $319,113 | |
| Previous Owner | Miklja Terri | $191,920 | |
| Previous Owner | Mickelson Phillip | $133,000 | |
| Previous Owner | Cornelsen Kevin E | $122,000 | |
| Previous Owner | Beeler Donald L | $125,546 |
Source: Public Records
Tax History Compared to Growth
Tax History
| Year | Tax Paid | Tax Assessment Tax Assessment Total Assessment is a certain percentage of the fair market value that is determined by local assessors to be the total taxable value of land and additions on the property. | Land | Improvement |
|---|---|---|---|---|
| 2025 | $4,216 | $438,481 | $215,000 | $223,481 |
| 2024 | $4,141 | $424,892 | $215,000 | $209,892 |
| 2023 | $4,332 | $432,931 | $204,000 | $228,931 |
| 2022 | $3,707 | $447,589 | $214,200 | $233,389 |
| 2021 | $3,525 | $363,175 | $174,000 | $189,175 |
| 2020 | $3,297 | $326,398 | $157,500 | $168,898 |
| 2019 | $2,892 | $308,205 | $150,000 | $158,205 |
| 2018 | $3,211 | $291,147 | $0 | $0 |
| 2017 | $2,928 | $259,825 | $0 | $0 |
| 2016 | $2,774 | $245,365 | $0 | $0 |
| 2015 | $2,683 | $222,560 | $0 | $0 |
| 2014 | -- | $205,752 | $0 | $0 |
| 2013 | -- | $178,555 | $0 | $0 |
Source: Public Records
Map
Nearby Homes
- 18213 SE 18th St
- 1819 SE 183rd Place
- 18508 SE 19th Way
- 18109 17th St
- 18107 17th St
- 18105 17th St
- 1604 181st Ave
- 1606 SE 181st Ave
- 1602 SE 181st Ave
- 1617 SE 180th Ave
- 1817 SE 186th Place
- 1513 SE 186th Ct
- 18520 SE 22nd Way
- 17813 SE 17th Ln
- 1316 SE 181st Ave
- 1218 SE Single Tree Dr
- Homesite 7 Plan at Union Estates
- Homesite 6 Plan at Union Estates
- Homesite 5 Plan at Union Estates
- Homesite 4 Plan at Union Estates
- 18214 SE 18th Way
- 18221 SE 18th St
- 18217 SE 18th St
- 18210 SE 18th Way
- 18219 SE 18th Way
- 1811 SE 183rd Place
- 18215 SE 18th Way
- 1807 SE 183rd Place
- 18206 SE 18th Way
- 18211 SE 18th Way
- 18301 SE 18th Way
- 1803 SE 183rd Place
- 18303 SE 18th Way
- 18207 SE 18th Way
- 18218 SE 19th St
- 18220 SE 18th St
- 18202 SE 18th Way
- 18214 SE 19th St
- 18216 SE 18th St
- 18210 SE 19th St