Estimated Value: $244,000 - $408,280
3
Beds
2
Baths
2,000
Sq Ft
$174/Sq Ft
Est. Value
About This Home
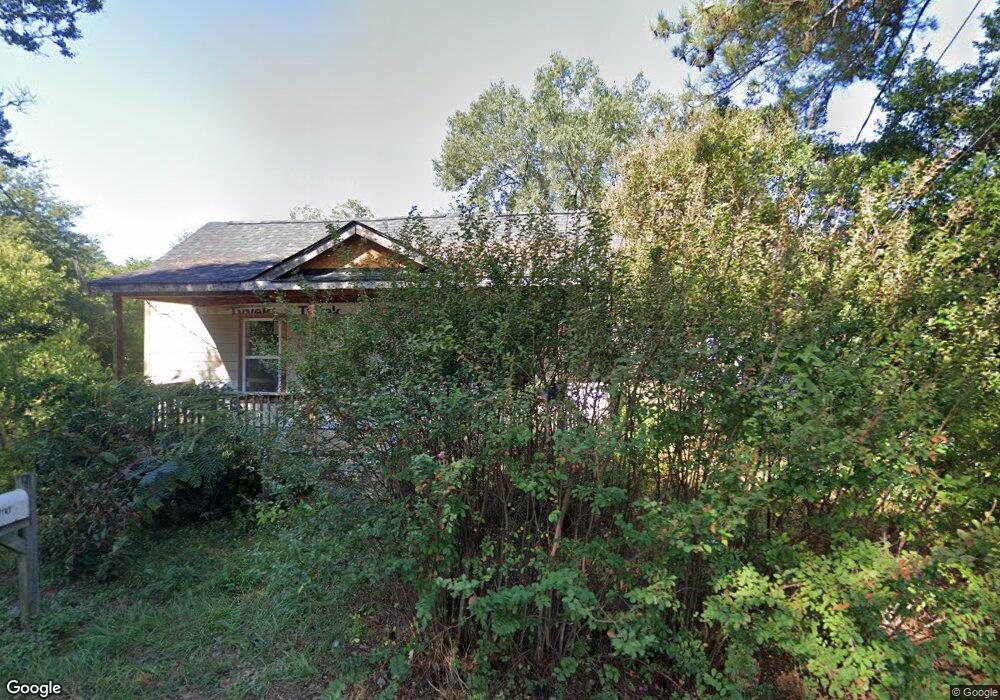
This home is located at 1822 8th St, Cayce, SC 29033 and is currently estimated at $347,320, approximately $173 per square foot. 1822 8th St is a home located in Lexington County with nearby schools including Cayce Elementary, Cyril B. Busbee Creative Arts Academy, and Brookland-Cayce High School.
Ownership History
Date
Name
Owned For
Owner Type
Purchase Details
Closed on
Feb 29, 2024
Sold by
Hollerstone Investments Llc
Bought by
Balko Kellie and Ewing Linda
Current Estimated Value
Home Financials for this Owner
Home Financials are based on the most recent Mortgage that was taken out on this home.
Original Mortgage
$341,700
Outstanding Balance
$335,984
Interest Rate
6.6%
Mortgage Type
New Conventional
Estimated Equity
$11,336
Purchase Details
Closed on
Feb 2, 2023
Sold by
Fusion Real Estate Investment Group Llc
Bought by
Hollerstone Investments Llc
Purchase Details
Closed on
Oct 25, 2018
Sold by
Aughtry Christine D
Bought by
Aughtry Christine D
Home Financials for this Owner
Home Financials are based on the most recent Mortgage that was taken out on this home.
Original Mortgage
$70,000
Interest Rate
4.6%
Mortgage Type
New Conventional
Purchase Details
Closed on
Sep 30, 2005
Sold by
Aughtry Earle F
Bought by
Aughtry Christine D
Create a Home Valuation Report for This Property
The Home Valuation Report is an in-depth analysis detailing your home's value as well as a comparison with similar homes in the area
Home Values in the Area
Average Home Value in this Area
Purchase History
| Date | Buyer | Sale Price | Title Company |
|---|---|---|---|
| Balko Kellie | $402,000 | None Listed On Document | |
| Hollerstone Investments Llc | $100,000 | -- | |
| Aughtry Christine D | $25,000 | None Available | |
| Aughtry Christine D | -- | -- |
Source: Public Records
Mortgage History
| Date | Status | Borrower | Loan Amount |
|---|---|---|---|
| Open | Balko Kellie | $341,700 | |
| Previous Owner | Aughtry Christine D | $70,000 |
Source: Public Records
Tax History
| Year | Tax Paid | Tax Assessment Tax Assessment Total Assessment is a certain percentage of the fair market value that is determined by local assessors to be the total taxable value of land and additions on the property. | Land | Improvement |
|---|---|---|---|---|
| 2024 | $2,791 | $4,000 | $1,600 | $2,400 |
| 2023 | $722 | $2,100 | $2,040 | $60 |
| 2022 | $754 | $2,100 | $2,040 | $60 |
| 2020 | $2,285 | $6,055 | $2,100 | $3,955 |
| 2019 | $2,091 | $5,857 | $1,800 | $4,057 |
| 2018 | $387 | $2,213 | $680 | $1,533 |
| 2017 | $374 | $2,213 | $680 | $1,533 |
| 2016 | $380 | $2,213 | $680 | $1,533 |
| 2014 | $243 | $1,924 | $920 | $1,004 |
| 2013 | -- | $1,930 | $920 | $1,010 |
Source: Public Records
Map
Nearby Homes
- 822 Lexington Ave
- 762 Poplar St
- 754 Poplar St
- 750 Poplar St
- 746 Poplar St
- 0 Poplar St Unit Lot 1 598703
- 0 Lot 7 Poplar St
- 900 Naples Ave
- 1015 Naples Ave
- 900 Michaelmas (Aka "M" Ave) Ave
- 611 Naples Ave
- 827 Indigo Ave
- TBD Poplar Lots A B & C St
- 1040 Indigo Ave
- 1140 Karlaney Ave
- 2121 Lorick St
- 1249 Jessamine St
- 117 Odell Dr
- 121 Odell Dr
- 129 Odell Dr
Your Personal Tour Guide
Ask me questions while you tour the home.