Estimated Value: $78,000 - $110,000
3
Beds
1
Bath
936
Sq Ft
$94/Sq Ft
Est. Value
About This Home
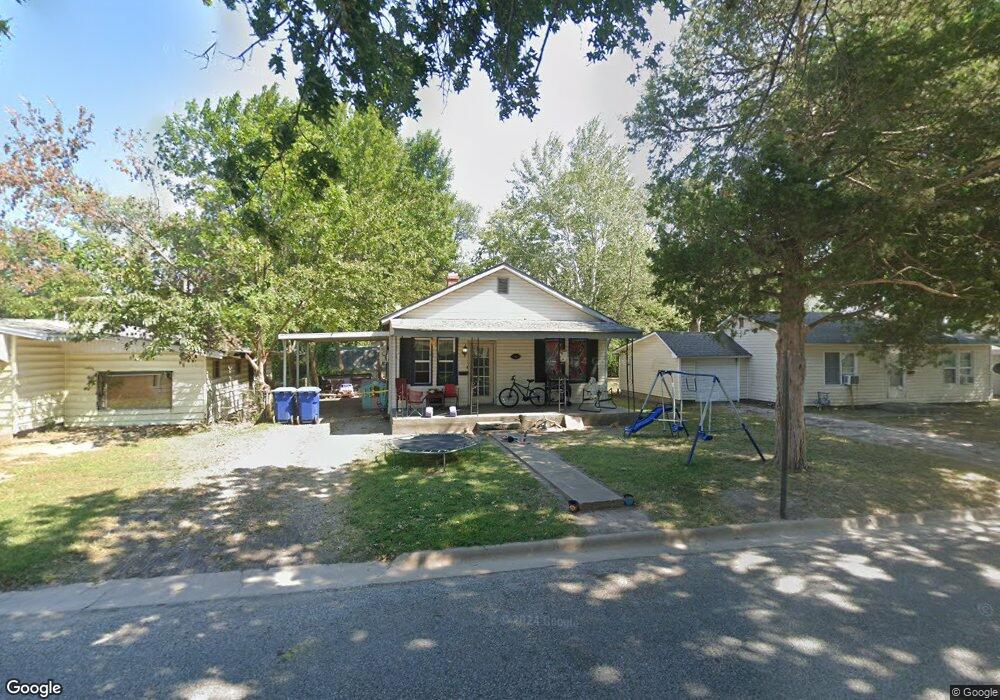
This home is located at 1822 B St NE, Miami, OK 74354 and is currently estimated at $87,998, approximately $94 per square foot. 1822 B St NE is a home located in Ottawa County with nearby schools including Miami High School and Mt. Olive Lutheran School.
Ownership History
Date
Name
Owned For
Owner Type
Purchase Details
Closed on
Jan 28, 2011
Sold by
Baird Brett A and Baird Becky R
Bought by
Cavello Gonzalez Giovanni Cavello and Cavello Penaloza Margarito
Current Estimated Value
Home Financials for this Owner
Home Financials are based on the most recent Mortgage that was taken out on this home.
Original Mortgage
$40,935
Outstanding Balance
$28,357
Interest Rate
5.12%
Mortgage Type
FHA
Estimated Equity
$59,641
Purchase Details
Closed on
Apr 23, 2010
Sold by
Wilson Courtney D
Bought by
Bard Brett A and Bard Becky R
Purchase Details
Closed on
Aug 10, 2007
Sold by
Laub Patricia J and The Patricia J Laub Revocable
Bought by
Wilson Courtney D
Purchase Details
Closed on
Jan 26, 2000
Bought by
Laub Patricia J
Purchase Details
Closed on
Aug 5, 1996
Bought by
Eby R F
Create a Home Valuation Report for This Property
The Home Valuation Report is an in-depth analysis detailing your home's value as well as a comparison with similar homes in the area
Home Values in the Area
Average Home Value in this Area
Purchase History
| Date | Buyer | Sale Price | Title Company |
|---|---|---|---|
| Cavello Gonzalez Giovanni Cavello | $42,000 | Ottawa County Abstract & Tit | |
| Bard Brett A | $23,000 | Ottawa County Abstract & Tit | |
| Wilson Courtney D | $50,000 | None Available | |
| Laub Patricia J | $18,000 | -- | |
| Eby R F | -- | -- |
Source: Public Records
Mortgage History
| Date | Status | Borrower | Loan Amount |
|---|---|---|---|
| Open | Cavello Gonzalez Giovanni Cavello | $40,935 |
Source: Public Records
Tax History Compared to Growth
Tax History
| Year | Tax Paid | Tax Assessment Tax Assessment Total Assessment is a certain percentage of the fair market value that is determined by local assessors to be the total taxable value of land and additions on the property. | Land | Improvement |
|---|---|---|---|---|
| 2025 | $681 | $6,576 | $570 | $6,006 |
| 2024 | $681 | $7,060 | $570 | $6,490 |
| 2023 | $681 | $6,724 | $570 | $6,154 |
| 2022 | $592 | $6,404 | $570 | $5,834 |
| 2021 | $576 | $6,099 | $570 | $5,529 |
| 2020 | $554 | $5,809 | $570 | $5,239 |
| 2019 | $480 | $5,846 | $536 | $5,310 |
| 2018 | $482 | $5,828 | $529 | $5,299 |
| 2017 | $382 | $5,550 | $426 | $5,124 |
| 2016 | $353 | $5,388 | $366 | $5,022 |
| 2015 | $182 | $2,052 | $398 | $1,654 |
| 2014 | $334 | $5,079 | $389 | $4,690 |
Source: Public Records
Map
Nearby Homes