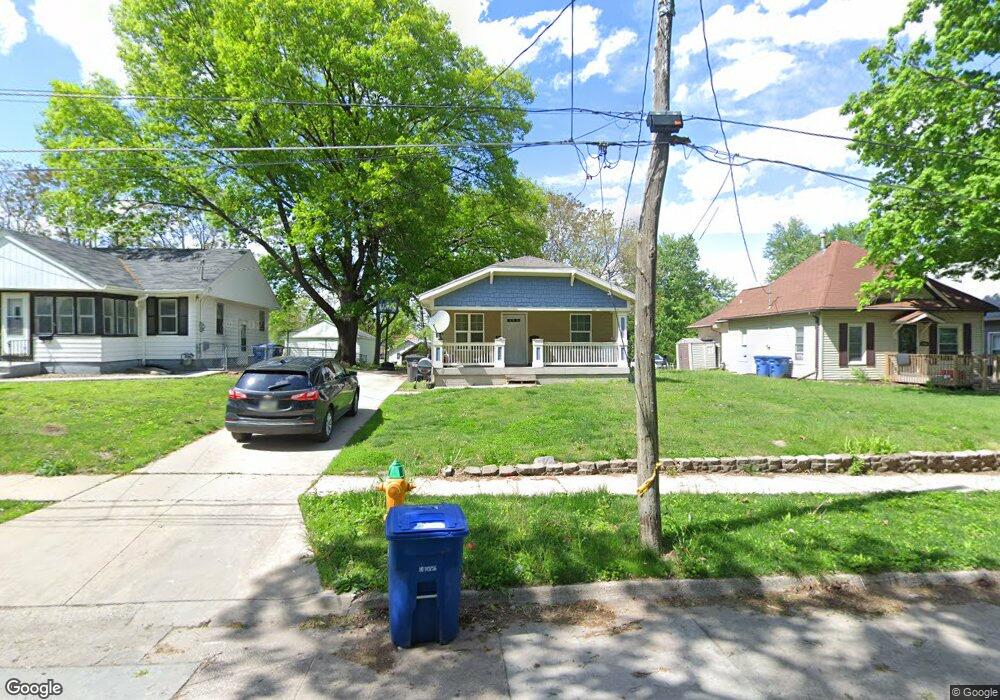
1822 Logan Ave Des Moines, IA 50316
Capitol East NeighborhoodEstimated Value: $169,000 - $268,000
3
Beds
2
Baths
1,200
Sq Ft
$191/Sq Ft
Est. Value
About This Home
This home is located at 1822 Logan Ave, Des Moines, IA 50316 and is currently estimated at $228,784, approximately $190 per square foot. 1822 Logan Ave is a home located in Polk County with nearby schools including Capitol View Elementary School, Hiatt Middle School, and East High School.
Ownership History
Date
Name
Owned For
Owner Type
Purchase Details
Closed on
Oct 3, 2012
Sold by
Greater Des Moines Habitat For Humanity
Bought by
Mathiang Valentino and Wal Anyaz
Current Estimated Value
Home Financials for this Owner
Home Financials are based on the most recent Mortgage that was taken out on this home.
Original Mortgage
$104,064
Interest Rate
3.66%
Mortgage Type
Purchase Money Mortgage
Purchase Details
Closed on
Aug 18, 2009
Sold by
Nfc Properties Llc
Bought by
Greater Des Moines Habitat For Humanity
Purchase Details
Closed on
Sep 10, 2008
Sold by
Neighborhood Finance Corp
Bought by
Nfc Properties Llc
Purchase Details
Closed on
Feb 20, 1997
Sold by
Hodges Donald R and Hodges Rick
Bought by
Murphy Cheryl L
Home Financials for this Owner
Home Financials are based on the most recent Mortgage that was taken out on this home.
Original Mortgage
$43,950
Interest Rate
7.74%
Create a Home Valuation Report for This Property
The Home Valuation Report is an in-depth analysis detailing your home's value as well as a comparison with similar homes in the area
Home Values in the Area
Average Home Value in this Area
Purchase History
| Date | Buyer | Sale Price | Title Company |
|---|---|---|---|
| Mathiang Valentino | $124,000 | None Available | |
| Greater Des Moines Habitat For Humanity | $9,000 | None Available | |
| Nfc Properties Llc | -- | None Available | |
| Murphy Cheryl L | $44,500 | -- |
Source: Public Records
Mortgage History
| Date | Status | Borrower | Loan Amount |
|---|---|---|---|
| Previous Owner | Mathiang Valentino | $104,064 | |
| Previous Owner | Murphy Cheryl L | $43,950 |
Source: Public Records
Tax History
| Year | Tax Paid | Tax Assessment Tax Assessment Total Assessment is a certain percentage of the fair market value that is determined by local assessors to be the total taxable value of land and additions on the property. | Land | Improvement |
|---|---|---|---|---|
| 2025 | $4,042 | $250,500 | $29,500 | $221,000 |
| 2024 | $4,042 | $215,900 | $25,100 | $190,800 |
| 2023 | $3,852 | $215,900 | $25,100 | $190,800 |
| 2022 | $3,820 | $172,300 | $20,600 | $151,700 |
| 2021 | $3,554 | $172,300 | $20,600 | $151,700 |
| 2020 | $3,686 | $151,000 | $18,000 | $133,000 |
| 2019 | $3,324 | $151,000 | $18,000 | $133,000 |
| 2018 | $376 | $132,200 | $15,500 | $116,700 |
| 2017 | $180 | $132,200 | $15,500 | $116,700 |
| 2016 | $170 | $124,500 | $14,400 | $110,100 |
| 2015 | $170 | $124,500 | $14,400 | $110,100 |
| 2014 | $44 | $116,500 | $13,300 | $103,200 |
Source: Public Records
Map
Nearby Homes
- 1820 E Walnut St
- 1841 Des Moines St
- 2024 Capitol Ave
- 2048 E Walnut St
- 1609 E Court Ave
- 1610 E Grand Ave
- 1621 Des Moines St
- 1929 Burson St
- 2158 E Walnut St
- 2101 Lyon St
- 2216 Logan Ave
- 2057 Maple St
- 104 E 15th St
- 2300 Dean Ave
- 2228 Lyon St
- 2238 Lyon St
- 824 E 22nd Ct
- 2343 E Grand Ave
- 1273 E 18th St
- 1241 E 17th Ct
- 1820 Logan Ave
- 1826 Logan Ave
- 1814 Logan Ave
- 1828 Logan Ave
- 1825 Logan Ave
- 1830 Logan Ave
- 1810 Logan Ave
- 1819 Logan Ave
- 1821 E Walnut St
- 1825 E Walnut St
- 1832 Logan Ave
- 1817 E Walnut St
- 1817 Logan Ave
- 1829 E Walnut St
- 1831 Logan Ave
- 1815 E Walnut St
- 1833 E Walnut St
- 1815 Logan Ave
- 1833 Logan Ave
- 1808 Logan Ave
Your Personal Tour Guide
Ask me questions while you tour the home.