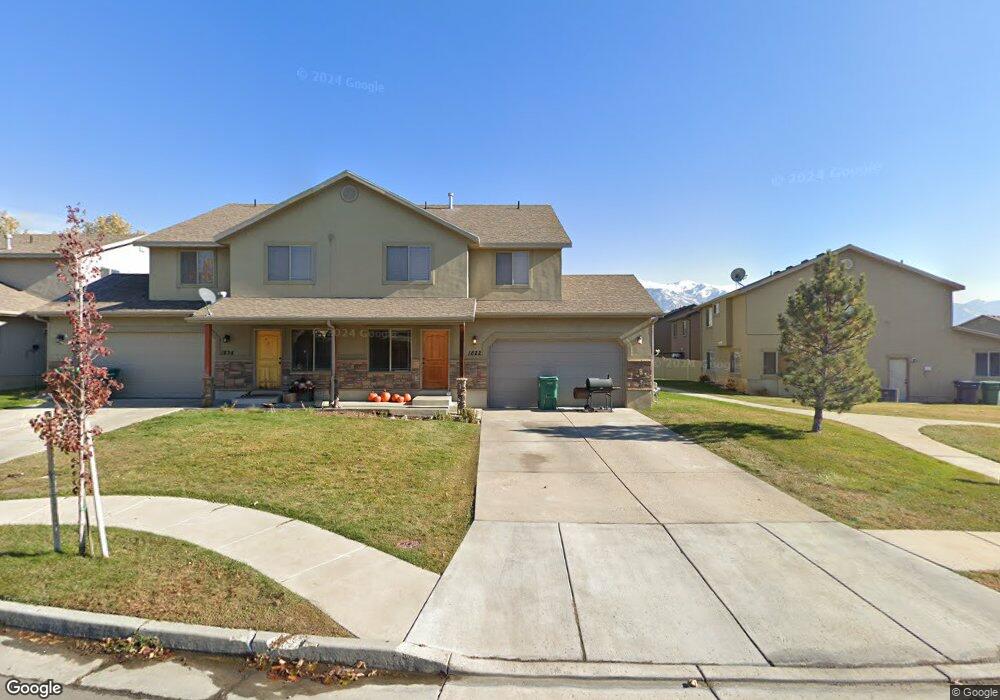
1822 N Belvedere Way Layton, UT 84041
Estimated Value: $390,000 - $429,000
4
Beds
3
Baths
1,765
Sq Ft
$233/Sq Ft
Est. Value
About This Home
This home is located at 1822 N Belvedere Way, Layton, UT 84041 and is currently estimated at $410,767, approximately $232 per square foot. 1822 N Belvedere Way is a home located in Davis County with nearby schools including Lincoln Elementary School, North Layton Junior High School, and Northridge High School.
Ownership History
Date
Name
Owned For
Owner Type
Purchase Details
Closed on
Aug 31, 2009
Sold by
Aurora Loan Services Llc
Bought by
Henderson David and Henderson Anna
Current Estimated Value
Home Financials for this Owner
Home Financials are based on the most recent Mortgage that was taken out on this home.
Original Mortgage
$166,920
Outstanding Balance
$108,666
Interest Rate
5.18%
Mortgage Type
FHA
Estimated Equity
$302,101
Purchase Details
Closed on
Jul 2, 2009
Sold by
Foster Michael and Foster Nelly
Bought by
Aurora Loan Services Llc
Home Financials for this Owner
Home Financials are based on the most recent Mortgage that was taken out on this home.
Original Mortgage
$166,920
Outstanding Balance
$108,666
Interest Rate
5.18%
Mortgage Type
FHA
Estimated Equity
$302,101
Purchase Details
Closed on
May 8, 2006
Sold by
Mark Higley Construction Lc
Bought by
Foster Michael and Foster Nelly
Create a Home Valuation Report for This Property
The Home Valuation Report is an in-depth analysis detailing your home's value as well as a comparison with similar homes in the area
Home Values in the Area
Average Home Value in this Area
Purchase History
| Date | Buyer | Sale Price | Title Company |
|---|---|---|---|
| Henderson David | -- | Surety Title Agency | |
| Aurora Loan Services Llc | $194,485 | Inwest Title Services Inc | |
| Foster Michael | -- | Heritage West Title Ins Agen |
Source: Public Records
Mortgage History
| Date | Status | Borrower | Loan Amount |
|---|---|---|---|
| Open | Henderson David | $166,920 |
Source: Public Records
Tax History Compared to Growth
Tax History
| Year | Tax Paid | Tax Assessment Tax Assessment Total Assessment is a certain percentage of the fair market value that is determined by local assessors to be the total taxable value of land and additions on the property. | Land | Improvement |
|---|---|---|---|---|
| 2025 | $1,907 | $200,200 | $68,200 | $132,000 |
| 2024 | $1,831 | $193,600 | $52,250 | $141,350 |
| 2023 | $1,953 | $364,000 | $91,000 | $273,000 |
| 2022 | $1,983 | $200,750 | $45,650 | $155,100 |
| 2021 | $1,862 | $281,000 | $69,000 | $212,000 |
| 2020 | $1,726 | $250,000 | $51,000 | $199,000 |
| 2019 | $1,727 | $245,000 | $49,000 | $196,000 |
| 2018 | $1,510 | $215,000 | $49,000 | $166,000 |
| 2016 | $1,364 | $100,155 | $26,950 | $73,205 |
| 2015 | $1,311 | $91,410 | $26,950 | $64,460 |
| 2014 | $1,343 | $95,727 | $18,333 | $77,394 |
| 2013 | -- | $82,765 | $13,701 | $69,064 |
Source: Public Records
Map
Nearby Homes
- 1908 N 200 W
- 2044 Evans Cove Loop
- 2048 Evans Cove Loop
- 1583 N 25 E
- 9 W 2150 N
- 23 E 2150 N
- 398 Paul Ave
- 1490 N 175 W
- 1837 N 440 W
- 1553 N 250 E
- 506 W 2200 N
- 1474 N 285 E
- 95 W 2400 N
- 2248 N 500 W
- 2211 N 525 W
- 2500 N Fort Ln Unit 189
- 2500 N Fort Ln Unit 238
- 324 E 1325 N
- 2600 N Hill Field Rd Unit 4
- 1180 N 100 E
- 1834 N Belvedere Way
- 1834 N Belvedere Way Unit 53
- 1844 N Belvedere Way
- 1780 N Belvedere Way
- 111 W 1850 N
- 1780 N Belvedere Way
- 1780 N Belvedere Way Unit 113
- 1778 N Belvedere Way Unit 114
- 1778 N Belvedere Way
- 97 W 1850 N
- 1823 N Belvedere Way
- 1845 N Belvedere Way
- 1833 N Belvedere Way
- 1813 N Belvedere Way
- 89 W 1850 N
- 1776 N Belvedere Way
- 1791 N Belvedere Way
- 1797 N Belvedere Way
- 1787 N Belvedere Way
- 1781 N Belvedere Way