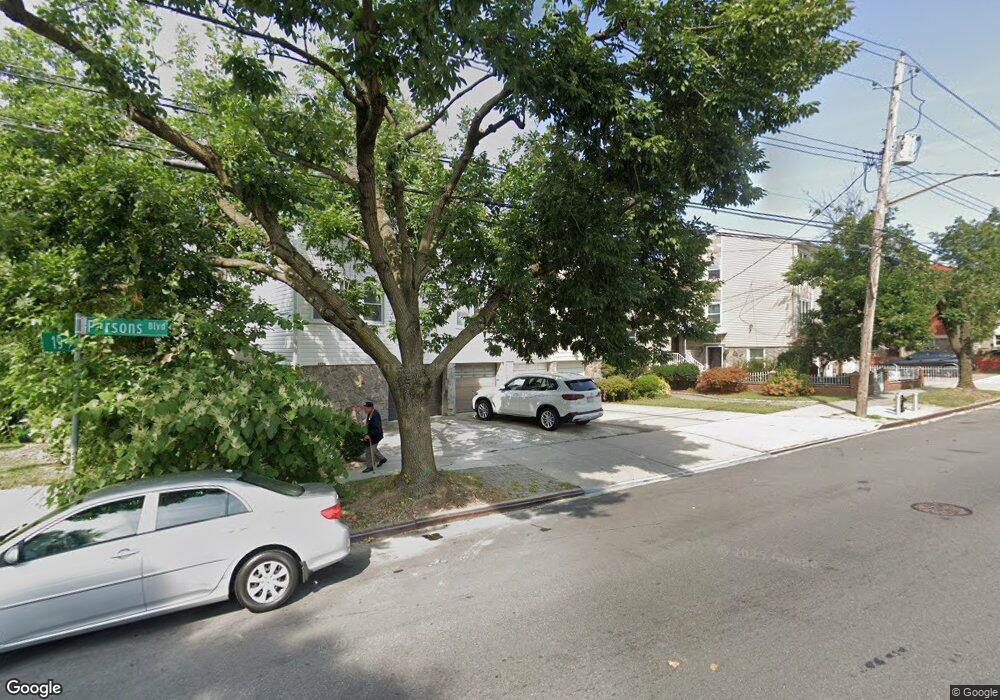
1822 Parsons Blvd Whitestone, NY 11357
Whitestone NeighborhoodEstimated Value: $1,601,000 - $1,749,000
Studio
--
Bath
2,895
Sq Ft
$584/Sq Ft
Est. Value
About This Home
This home is located at 1822 Parsons Blvd, Whitestone, NY 11357 and is currently estimated at $1,691,256, approximately $584 per square foot. 1822 Parsons Blvd is a home located in Queens County with nearby schools including P.S. 79 - Francis Lewis, Jhs 185 Edward Bleeker, and Flushing High School.
Ownership History
Date
Name
Owned For
Owner Type
Purchase Details
Closed on
Mar 13, 2002
Sold by
Hahn Byung K
Bought by
Choi David
Current Estimated Value
Home Financials for this Owner
Home Financials are based on the most recent Mortgage that was taken out on this home.
Original Mortgage
$350,000
Interest Rate
7.18%
Mortgage Type
Purchase Money Mortgage
Purchase Details
Closed on
Jul 6, 2000
Sold by
Tung Shu Chueh
Bought by
Hahn Byung K
Home Financials for this Owner
Home Financials are based on the most recent Mortgage that was taken out on this home.
Original Mortgage
$340,000
Interest Rate
8.49%
Mortgage Type
Stand Alone First
Purchase Details
Closed on
Sep 16, 1993
Sold by
Tung Shu Chueh and Tung Sheau Ling
Bought by
Tung Shu Chueh
Create a Home Valuation Report for This Property
The Home Valuation Report is an in-depth analysis detailing your home's value as well as a comparison with similar homes in the area
Home Values in the Area
Average Home Value in this Area
Purchase History
| Date | Buyer | Sale Price | Title Company |
|---|---|---|---|
| Choi David | -- | -- | |
| Choi David | -- | -- | |
| Hahn Byung K | $488,000 | -- | |
| Hahn Byung K | $488,000 | -- | |
| Tung Shu Chueh | -- | Commonwealth Land Title Ins | |
| Tung Shu Chueh | -- | Commonwealth Land Title Ins |
Source: Public Records
Mortgage History
| Date | Status | Borrower | Loan Amount |
|---|---|---|---|
| Previous Owner | Choi David | $350,000 | |
| Previous Owner | Hahn Byung K | $340,000 |
Source: Public Records
Tax History
| Year | Tax Paid | Tax Assessment Tax Assessment Total Assessment is a certain percentage of the fair market value that is determined by local assessors to be the total taxable value of land and additions on the property. | Land | Improvement |
|---|---|---|---|---|
| 2025 | $6,833 | $72,127 | $9,900 | $62,227 |
| 2024 | $6,833 | $68,045 | $9,204 | $58,841 |
| 2023 | $6,447 | $64,195 | $7,388 | $56,807 |
| 2022 | $6,259 | $94,560 | $11,760 | $82,800 |
| 2021 | $6,598 | $82,740 | $11,760 | $70,980 |
| 2020 | $8,906 | $85,980 | $11,760 | $74,220 |
| 2019 | $8,303 | $94,680 | $11,760 | $82,920 |
| 2018 | $10,905 | $53,496 | $8,623 | $44,873 |
| 2017 | $10,652 | $52,254 | $10,150 | $42,104 |
| 2016 | $10,446 | $52,254 | $10,150 | $42,104 |
| 2015 | $5,726 | $50,089 | $11,362 | $38,727 |
| 2014 | $5,726 | $47,254 | $12,441 | $34,813 |
Source: Public Records
Map
Nearby Homes
- 15-43 144th St
- 1537 144th St
- 2023 Whitestone Expy
- 21-12 144th St
- 145-04 14th Ave
- 14712 15th Dr
- 14315 22nd Rd
- 1352 145th Place
- 16-11 149th St
- 149-20 17th Ave
- 13-22 140th St
- 22-01 149th St
- 2311 Whitestone Expy
- 1535 149th St
- 145-17 Willets Point Blvd
- 1527 149th St
- 14718 24th Ave
- 14940 15th Dr
- 1620 150th St
- 14632 Willets Point Blvd
- 1820 Parsons Blvd
- 1820 Parsons Blvd
- 1814 Parsons Blvd
- 1597 144th St
- 1599 144th St
- 1595 144th St
- 1593 144th St
- 1593 144th St
- 1593 144th St
- 1591 144th St
- 18-12 Parsons Blvd
- 18-12 Parsons Blvd Unit 2nd
- 18-12 Parsons Blvd Unit 2F
- 18-12 Parsons Blvd Unit 2FL
- 1589 144th St
- 1812 Parsons Blvd
- 1589 144th St
- 1589 144th St
- 1587 144th St
- 15-85 144th St
Your Personal Tour Guide
Ask me questions while you tour the home.