A
Seller's Agent in 2019
Amanda Wiley & K Team
Era All In One Realty
(229) 888-6670
57 in this area
2,617 Total Sales
Estimated Value: $214,671 - $261,000
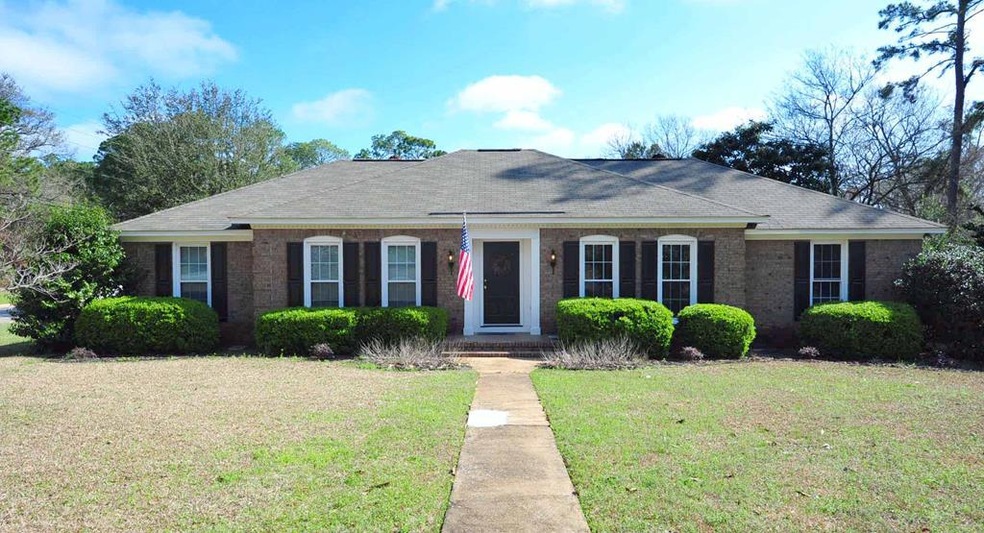
LAKE PARK REMODEL! OPEN, LIGHT & AIRY Describes this modern home! Situated on a corner lot, the 3 bedroom 2 bath PLUS OFFICE/PLAYROOM home has 1830 sqft and loads of charm and appeal! BE WOWED when you walk through the door.. Open kitchen, living room and dining room, perfect for entertaining and family living! All flooring (except bathrooms) are new laminate wood floors throughout the house! NEW INTERIOR & EXTERIOR PAINT! Living room with fireplace, built ins and recessed lighting! AMAZING KITCHEN complete with QUARTZ COUNTER TOPS, NEW CABINETS, new back splash, pantry, new stainless appliances, window over the sink with views of the backyard and CENTER ISLAND with breakfast bar! Spacious dining area with new lighting and large windows for natural light! Office/Playroom area has french doors for privacy and could be used for a multitude of different spaces depending on your need! Master suite has walk in closet and a lovely bathroom with new vanity, tile floors and terrific tiled shower!The additional bedrooms are large with ample closet space! The hall bathroom has new floors, new granite counter tops w/ two under mounted sinks and new lighting! Nice laundry room, NEW WASHER & DRYER INCLUDED! Outside boasts a double carport, huge .62 acre yard, storage building, fenced yard, open patio great for grilling, new windows, Roof only 10 years old! Plush landscaping and street appeal galore! Wonderful location and neighborhood close to everything! Well kept, Modern and Beautiful Inside and Out!
Last Agent to Sell the Property
Era All In One Realty Brokerage Phone: 2298886670 License #309999 Listed on: 03/30/2019
| Date | Buyer | Sale Price | Title Company |
|---|---|---|---|
| Newell Murphy | $162,500 | -- | |
| Miller Matthew R | $152,000 | -- | |
| Newell Mary | -- | -- | |
| Lane Latrelle | -- | -- | |
| Lane Lyoyd | $100,000 | -- | |
| Macey Mary R | -- | -- |
| Date | Status | Borrower | Loan Amount |
|---|---|---|---|
| Open | Newell Murphy | $159,556 | |
| Previous Owner | Miller Matthew R | $146,566 | |
| Closed | Lane Lyoyd | $0 |
| Date | Event | Price | List to Sale | Price per Sq Ft | Prior Sale |
|---|---|---|---|---|---|
| 05/15/2019 05/15/19 | Sold | $162,500 | +6.9% | $89 / Sq Ft | |
| 03/30/2019 03/30/19 | Pending | -- | -- | -- | |
| 07/30/2018 07/30/18 | Sold | $152,000 | -- | $83 / Sq Ft | View Prior Sale |
| 06/22/2018 06/22/18 | Pending | -- | -- | -- |
| Year | Tax Paid | Tax Assessment Tax Assessment Total Assessment is a certain percentage of the fair market value that is determined by local assessors to be the total taxable value of land and additions on the property. | Land | Improvement |
|---|---|---|---|---|
| 2024 | $2,488 | $52,160 | $12,880 | $39,280 |
| 2023 | $2,430 | $52,160 | $12,880 | $39,280 |
| 2022 | $2,439 | $52,160 | $12,880 | $39,280 |
| 2021 | $2,261 | $52,160 | $12,880 | $39,280 |
| 2020 | $2,267 | $52,160 | $12,880 | $39,280 |
| 2019 | $2,275 | $52,160 | $12,880 | $39,280 |
| 2018 | $2,246 | $51,280 | $12,880 | $38,400 |
| 2017 | $2,093 | $51,280 | $12,880 | $38,400 |
| 2016 | $2,094 | $51,280 | $12,880 | $38,400 |
| 2015 | $1,823 | $51,280 | $12,880 | $38,400 |
| 2014 | $1,744 | $50,000 | $11,600 | $38,400 |
A
Seller's Agent in 2019
Amanda Wiley & K Team
Era All In One Realty
(229) 888-6670
57 in this area
2,617 Total Sales

Buyer's Agent in 2019
Debbie Fulford
Re/Max Of Albany
6 in this area
155 Total Sales
Source: Albany Board of REALTORS®
MLS Number: 142448
APN: 000PP-00008-001