Estimated Value: $322,000 - $370,000
--
Bed
--
Bath
1,233
Sq Ft
$280/Sq Ft
Est. Value
About This Home
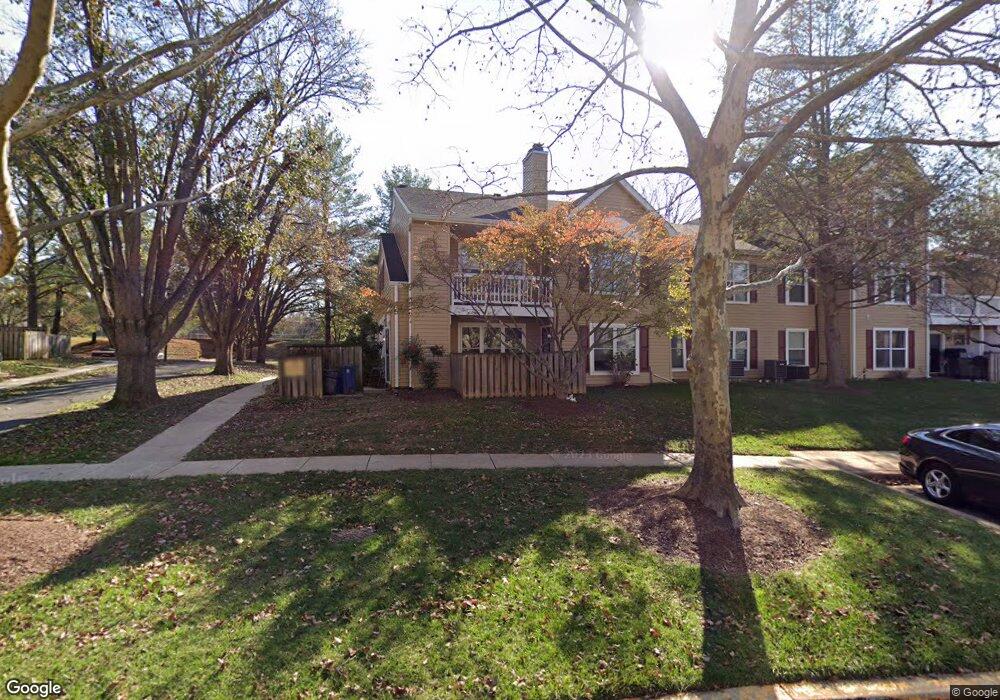
This home is located at 18225 Rolling Meadow Way Unit 214, Olney, MD 20832 and is currently estimated at $345,014, approximately $279 per square foot. 18225 Rolling Meadow Way Unit 214 is a home located in Montgomery County with nearby schools including Olney Elementary School, Rosa M. Parks Middle School, and Sherwood High School.
Ownership History
Date
Name
Owned For
Owner Type
Purchase Details
Closed on
Jun 19, 2008
Sold by
Kitts Elizabeth A
Bought by
Moasser Karime A
Current Estimated Value
Home Financials for this Owner
Home Financials are based on the most recent Mortgage that was taken out on this home.
Original Mortgage
$209,250
Outstanding Balance
$134,618
Interest Rate
6.1%
Mortgage Type
Stand Alone Refi Refinance Of Original Loan
Estimated Equity
$210,396
Purchase Details
Closed on
Jun 4, 2008
Sold by
Kitts Elizabeth A
Bought by
Moasser Karime A
Home Financials for this Owner
Home Financials are based on the most recent Mortgage that was taken out on this home.
Original Mortgage
$209,250
Outstanding Balance
$134,618
Interest Rate
6.1%
Mortgage Type
Stand Alone Refi Refinance Of Original Loan
Estimated Equity
$210,396
Purchase Details
Closed on
May 20, 1998
Sold by
Fed Natl Mortg Assoc
Bought by
Kitts Elizabeth A
Purchase Details
Closed on
Apr 27, 1998
Sold by
Killian Robert L
Bought by
Fed Natl Mortg Assoc
Create a Home Valuation Report for This Property
The Home Valuation Report is an in-depth analysis detailing your home's value as well as a comparison with similar homes in the area
Home Values in the Area
Average Home Value in this Area
Purchase History
| Date | Buyer | Sale Price | Title Company |
|---|---|---|---|
| Moasser Karime A | -- | -- | |
| Moasser Karime A | -- | -- | |
| Kitts Elizabeth A | $90,500 | -- | |
| Fed Natl Mortg Assoc | $102,000 | -- | |
| Fed Natl Mortg Assoc | $102,000 | -- |
Source: Public Records
Mortgage History
| Date | Status | Borrower | Loan Amount |
|---|---|---|---|
| Open | Moasser Karime A | $209,250 | |
| Closed | Moasser Karime A | $209,250 |
Source: Public Records
Tax History Compared to Growth
Tax History
| Year | Tax Paid | Tax Assessment Tax Assessment Total Assessment is a certain percentage of the fair market value that is determined by local assessors to be the total taxable value of land and additions on the property. | Land | Improvement |
|---|---|---|---|---|
| 2025 | $3,489 | $290,000 | $87,000 | $203,000 |
| 2024 | $3,489 | $270,000 | $0 | $0 |
| 2023 | $2,546 | $250,000 | $0 | $0 |
| 2022 | $1,854 | $230,000 | $69,000 | $161,000 |
| 2021 | $2,110 | $226,667 | $0 | $0 |
| 2020 | $4,099 | $223,333 | $0 | $0 |
| 2019 | $4,000 | $220,000 | $66,000 | $154,000 |
| 2018 | $1,960 | $216,667 | $0 | $0 |
| 2017 | $1,977 | $213,333 | $0 | $0 |
| 2016 | $1,806 | $210,000 | $0 | $0 |
| 2015 | $1,806 | $210,000 | $0 | $0 |
| 2014 | $1,806 | $210,000 | $0 | $0 |
Source: Public Records
Map
Nearby Homes
- 18119 Rolling Meadow Way Unit 215
- 18260 Rolling Meadow Way Unit 24
- 18290 Rolling Meadow Way Unit 4
- 3502 Dartmoor Ln
- 3437 Bantry Way
- 6 Wachs Ct
- 17800 Buehler Rd Unit 3
- 3011 Paladin Terrace
- 17801 Buehler Rd Unit 112
- 3323 Buehler Ct Unit 111
- 3224 Spartan Rd
- 3007 Viburnum Place
- 18026 Ohara Cir
- 18816 Stoneyhurst St
- 18120 Windsor Hill Dr
- 4004 Briars Rd
- 18324 Darnell Dr
- 18200 Windsor Hill Dr
- 0 Briars Rd
- 4201 Briars Rd
- 18223 Rolling Meadow Way Unit 213
- 18103 Rolling Meadow Way
- 18111 Rolling Meadow Way Unit 248
- 18221 Rolling Meadow Way
- 18207 Rolling Meadow Way Unit 222
- 18123 Rolling Meadow Way
- 18109 Rolling Meadow Way Unit 1
- 18203 Rolling Meadow Way Unit 220
- 18219 Rolling Meadow Way
- 18229 Rolling Meadow Way
- 18217 Rolling Meadow Way Unit 210
- 18263 Rolling Meadow Way Unit 16
- 18107 Rolling Meadow Way
- 18261 Rolling Meadow Way
- 18113 Rolling Meadow Way
- 18201 Rolling Meadow Way Unit 219
- 18215 Rolling Meadow Way
- 18101 Rolling Meadow Way Unit 243
- 18125 Rolling Meadow Way
- 18223 Rolling Meadow Way