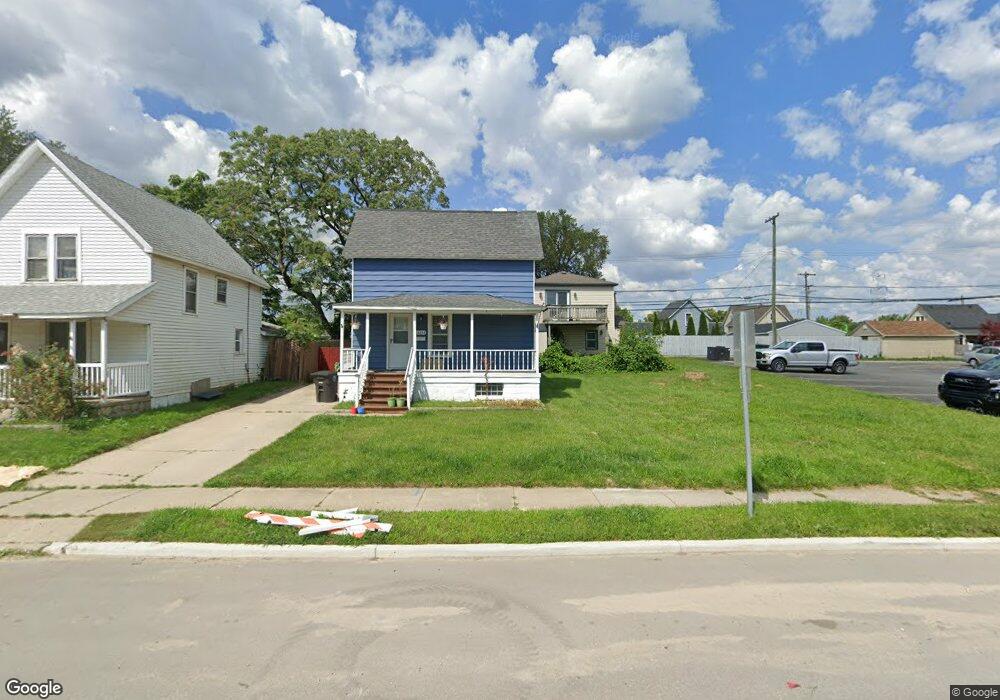
18226 Jefferson Riverview, MI 48193
Estimated Value: $81,000 - $88,000
1
Bed
1
Bath
814
Sq Ft
$106/Sq Ft
Est. Value
About This Home
This home is located at 18226 Jefferson, Riverview, MI 48193 and is currently estimated at $86,080, approximately $105 per square foot. 18226 Jefferson is a home located in Wayne County with nearby schools including Riverview Community High School.
Ownership History
Date
Name
Owned For
Owner Type
Purchase Details
Closed on
Apr 25, 2018
Sold by
Holoday Marianne and Holoday Daniel
Bought by
Holoday Marianne
Current Estimated Value
Purchase Details
Closed on
Jan 24, 2013
Sold by
Holoday Daniel B and Holoday Marianne
Bought by
Green Justin
Home Financials for this Owner
Home Financials are based on the most recent Mortgage that was taken out on this home.
Original Mortgage
$22,000
Interest Rate
7%
Mortgage Type
Seller Take Back
Purchase Details
Closed on
May 26, 2009
Sold by
Holoday Daniel
Bought by
Holoday Daniel
Purchase Details
Closed on
Aug 1, 2005
Sold by
Riling Delma L and The Delma L Riling Revocable T
Bought by
Holoday Daniel B
Purchase Details
Closed on
Nov 9, 2000
Sold by
Delma Riling
Bought by
Delma L Riling
Create a Home Valuation Report for This Property
The Home Valuation Report is an in-depth analysis detailing your home's value as well as a comparison with similar homes in the area
Home Values in the Area
Average Home Value in this Area
Purchase History
| Date | Buyer | Sale Price | Title Company |
|---|---|---|---|
| Holoday Marianne | -- | None Available | |
| Green Justin | $24,500 | Michigan Title Ins Agcy Inc | |
| Green Justin | $24,500 | Michigan Title Insurance Age | |
| Holoday Daniel | -- | None Available | |
| Holoday Daniel B | $58,000 | Multiple | |
| Delma L Riling | -- | -- |
Source: Public Records
Mortgage History
| Date | Status | Borrower | Loan Amount |
|---|---|---|---|
| Previous Owner | Green Justin | $22,000 |
Source: Public Records
Tax History
| Year | Tax Paid | Tax Assessment Tax Assessment Total Assessment is a certain percentage of the fair market value that is determined by local assessors to be the total taxable value of land and additions on the property. | Land | Improvement |
|---|---|---|---|---|
| 2025 | $1,552 | $35,300 | $0 | $0 |
| 2024 | $870 | $32,200 | $0 | $0 |
| 2023 | $781 | $27,300 | $0 | $0 |
| 2022 | $1,052 | $22,900 | $0 | $0 |
| 2021 | $987 | $21,500 | $0 | $0 |
| 2020 | $1,196 | $21,300 | $0 | $0 |
| 2019 | $958 | $19,100 | $0 | $0 |
| 2018 | $1,470 | $25,500 | $0 | $0 |
| 2017 | $716 | $25,200 | $0 | $0 |
| 2016 | $1,376 | $26,500 | $0 | $0 |
| 2015 | $2,388 | $26,600 | $0 | $0 |
| 2013 | $2,290 | $22,900 | $0 | $0 |
| 2012 | $1,504 | $23,500 | $7,900 | $15,600 |
Source: Public Records
Map
Nearby Homes
- 11571 Grant St
- 11859 Grant St
- 11930 Garfield St
- VACANT Sibley Rd
- 214 Detroit St
- 17591 Matthews St
- 17049 Reno St
- 17538 Matthews St
- 18055 Hinton St
- 4474 16th St
- 18031 Hamann St
- 17150 Matthews St
- 4413 18th St
- 18082 Ray St
- 0 West River Unit 20250008619
- 4028 18th St
- 4004 17th St
- 0000 Fort St
- 3894 17th St
- 17624 Parke Ln
- 18232 Jefferson
- 18238 Jefferson
- 18246 Jefferson
- 18225 Riverview St
- 18219 Riverview St
- 18233 Riverview St
- 18211 Riverview St
- 18239 Riverview St
- 18252 Jefferson
- 18205 Riverview St
- 18247 Riverview St
- 18253 Riverview St
- 18266 Jefferson
- 18261 Riverview St
- 18267 Riverview St
- 18117 Riverview St
- 18275 Riverview St
- 11234 Ford Ave
- 18280 Jefferson
- 18281 Riverview St
Your Personal Tour Guide
Ask me questions while you tour the home.