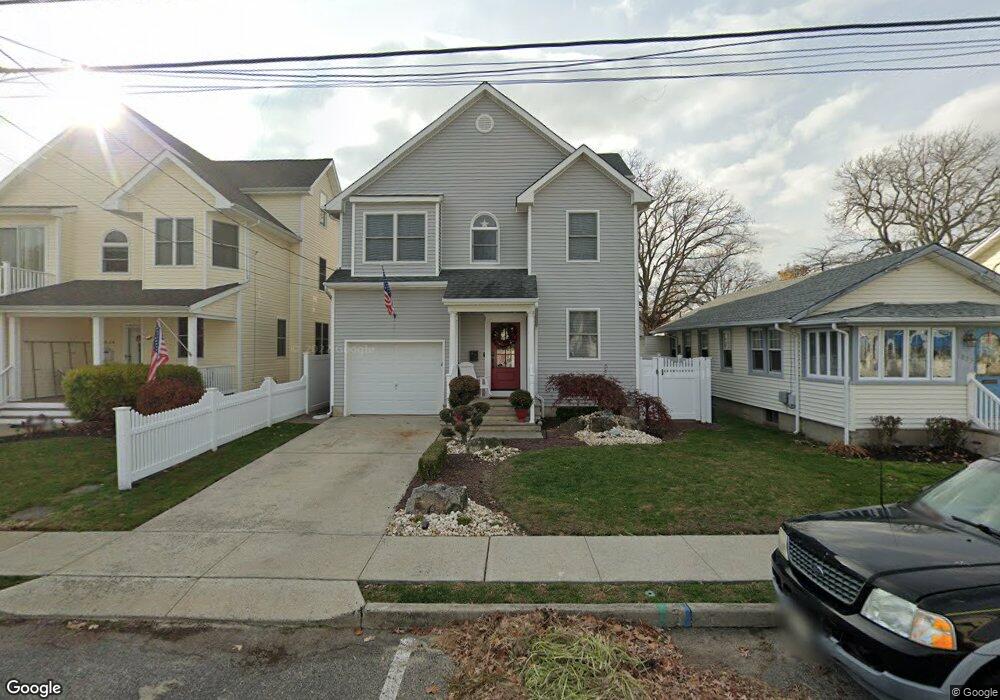
1823 1/2 Pine Terrace Belmar, NJ 07719
Estimated Value: $1,109,000 - $1,401,000
3
Beds
2
Baths
2,394
Sq Ft
$544/Sq Ft
Est. Value
About This Home
This home is located at 1823 1/2 Pine Terrace, Belmar, NJ 07719 and is currently estimated at $1,303,462, approximately $544 per square foot. 1823 1/2 Pine Terrace is a home located in Monmouth County with nearby schools including St. Rose Grammar School and St Rose High School.
Ownership History
Date
Name
Owned For
Owner Type
Purchase Details
Closed on
Mar 19, 2014
Sold by
Plaskon Edward
Bought by
Roach Patricia and Roach Andrew
Current Estimated Value
Home Financials for this Owner
Home Financials are based on the most recent Mortgage that was taken out on this home.
Original Mortgage
$312,500
Outstanding Balance
$236,233
Interest Rate
4.27%
Mortgage Type
New Conventional
Estimated Equity
$1,067,229
Purchase Details
Closed on
May 4, 2006
Sold by
Foley Enterprises Llc
Bought by
Plaskon Edward J
Home Financials for this Owner
Home Financials are based on the most recent Mortgage that was taken out on this home.
Original Mortgage
$395,000
Interest Rate
5.62%
Mortgage Type
Adjustable Rate Mortgage/ARM
Purchase Details
Closed on
Jun 18, 2004
Sold by
1825 Pine Terrace Partners Llc
Bought by
Foley Enterprises Llc
Create a Home Valuation Report for This Property
The Home Valuation Report is an in-depth analysis detailing your home's value as well as a comparison with similar homes in the area
Home Values in the Area
Average Home Value in this Area
Purchase History
| Date | Buyer | Sale Price | Title Company |
|---|---|---|---|
| Roach Patricia | $537,500 | None Available | |
| Plaskon Edward J | $582,500 | -- | |
| Foley Enterprises Llc | $229,000 | -- |
Source: Public Records
Mortgage History
| Date | Status | Borrower | Loan Amount |
|---|---|---|---|
| Open | Roach Patricia | $312,500 | |
| Previous Owner | Plaskon Edward J | $395,000 |
Source: Public Records
Tax History Compared to Growth
Tax History
| Year | Tax Paid | Tax Assessment Tax Assessment Total Assessment is a certain percentage of the fair market value that is determined by local assessors to be the total taxable value of land and additions on the property. | Land | Improvement |
|---|---|---|---|---|
| 2025 | $11,659 | $1,115,900 | $565,000 | $550,900 |
| 2024 | $10,792 | $1,043,800 | $500,000 | $543,800 |
| 2023 | $10,792 | $941,700 | $550,000 | $391,700 |
| 2022 | $9,989 | $905,000 | $530,000 | $375,000 |
| 2021 | $9,989 | $690,300 | $355,000 | $335,300 |
| 2020 | $9,319 | $653,500 | $324,000 | $329,500 |
| 2019 | $8,613 | $589,100 | $324,000 | $265,100 |
| 2018 | $8,884 | $570,600 | $315,000 | $255,600 |
| 2017 | $9,225 | $543,600 | $294,500 | $249,100 |
| 2016 | $9,774 | $554,100 | $310,000 | $244,100 |
| 2015 | $9,568 | $524,300 | $280,000 | $244,300 |
| 2014 | $8,913 | $524,300 | $280,000 | $244,300 |
Source: Public Records
Map
Nearby Homes
- 1817 Pine Terrace Unit 2
- 1825 Pine Terrace
- 1800-1802 Pine Terrace
- 1822 Laurel Terrace
- 1806 Fernwood Rd
- 620 Redmond Ave
- 1730 Newman St
- 708 18th Ave
- 615 17th Ave
- 1700 Main St Unit 303
- 405 16th Ave
- 745 20th Ave
- 725 17th Ave
- 1813 Margerum Ave
- 1903 Margerum Ave
- 404 16th Ave
- 322 16th Ave
- 517 14th Ave
- 206 Monroe Ave
- 204 Monroe Ave
- 1823 Pine Terrace
- 1823 Pine Terrace Unit 1/2
- 1827 Pine Terrace
- 1821 Pine Terrace
- 1819 Pine Terrace Unit 2
- 1822 Briarwood Terrace
- 1824 Briarwood Terrace
- 1824 Briarwood Terrace
- 1824 Briarwood Terrace Unit Front
- 1820 Briarwood Terrace
- 1829 Pine Terrace Unit 2
- 1826 Briarwood Terrace
- 1818 Briarwood Terrace
- 1824 Pine Terrace
- 1820 Pine Terrace Unit 2
- 1828 Briarwood Terrace
- 1828 Briarwood Terrace Unit 2
- 1828 Briarwood Terrace Unit 1
- 1818 1/2 Pine Terrace Unit 2
- 1831 Pine Terrace Unit 2