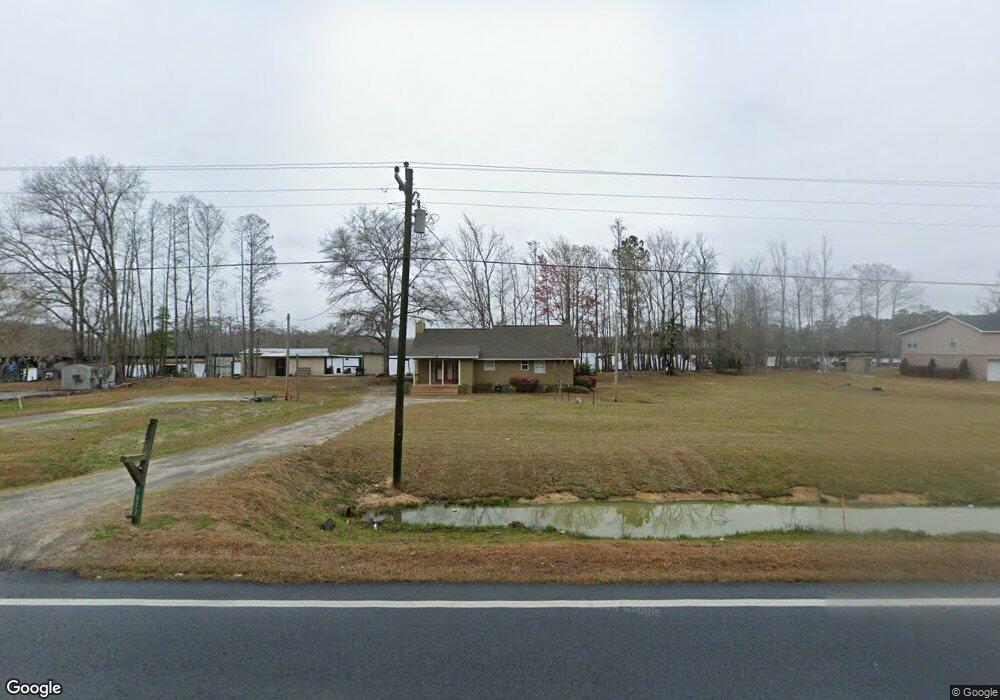
1823 Cypress Lake Rd Statesboro, GA 30458
Estimated Value: $360,000 - $512,000
3
Beds
2
Baths
1,475
Sq Ft
$291/Sq Ft
Est. Value
About This Home
This home is located at 1823 Cypress Lake Rd, Statesboro, GA 30458 and is currently estimated at $429,009, approximately $290 per square foot. 1823 Cypress Lake Rd is a home located in Bulloch County with nearby schools including Langston Chapel Elementary School, Statesboro High School, and Langston Chapel Middle School.
Ownership History
Date
Name
Owned For
Owner Type
Purchase Details
Closed on
Jun 3, 2021
Sold by
Fuzzy Family Properties Lllp
Bought by
Brannen Wyley W and Brannen Julie M
Current Estimated Value
Home Financials for this Owner
Home Financials are based on the most recent Mortgage that was taken out on this home.
Original Mortgage
$240,000
Outstanding Balance
$217,290
Interest Rate
2.9%
Mortgage Type
New Conventional
Estimated Equity
$211,719
Purchase Details
Closed on
Oct 11, 2007
Sold by
Not Provided
Bought by
Lanier Janet R
Home Financials for this Owner
Home Financials are based on the most recent Mortgage that was taken out on this home.
Original Mortgage
$215,178
Interest Rate
6.26%
Mortgage Type
New Conventional
Purchase Details
Closed on
Jun 7, 2004
Bought by
Edwards Gary D
Purchase Details
Closed on
Nov 1, 1999
Bought by
Clark Frances A
Purchase Details
Closed on
Aug 1, 1996
Bought by
Clark Frances A
Create a Home Valuation Report for This Property
The Home Valuation Report is an in-depth analysis detailing your home's value as well as a comparison with similar homes in the area
Home Values in the Area
Average Home Value in this Area
Purchase History
| Date | Buyer | Sale Price | Title Company |
|---|---|---|---|
| Brannen Wyley W | $300,000 | -- | |
| Lanier Janet R | $215,000 | -- | |
| Edwards Gary D | -- | -- | |
| Clark Frances A | -- | -- | |
| Clark Frances A | -- | -- |
Source: Public Records
Mortgage History
| Date | Status | Borrower | Loan Amount |
|---|---|---|---|
| Open | Brannen Wyley W | $240,000 | |
| Previous Owner | Lanier Janet R | $215,178 |
Source: Public Records
Tax History Compared to Growth
Tax History
| Year | Tax Paid | Tax Assessment Tax Assessment Total Assessment is a certain percentage of the fair market value that is determined by local assessors to be the total taxable value of land and additions on the property. | Land | Improvement |
|---|---|---|---|---|
| 2024 | $3,216 | $144,336 | $60,000 | $84,336 |
| 2023 | $1,546 | $63,536 | $12,440 | $51,096 |
| 2022 | $1,203 | $55,719 | $12,440 | $43,279 |
| 2021 | $1,090 | $49,238 | $12,440 | $36,798 |
| 2020 | $1,084 | $47,694 | $12,440 | $35,254 |
| 2019 | $1,081 | $47,348 | $12,440 | $34,908 |
| 2018 | $1,040 | $45,346 | $12,440 | $32,906 |
| 2017 | $1,025 | $44,122 | $12,440 | $31,682 |
| 2016 | $1,019 | $42,758 | $12,440 | $30,318 |
| 2015 | $1,003 | $41,875 | $12,440 | $29,435 |
| 2014 | $926 | $41,875 | $12,440 | $29,435 |
Source: Public Records
Map
Nearby Homes
- 129 Cypress Lake Dr
- 127 Turkey Trail
- 2581 Old Riggs Mill Rd
- 251 Jm Royal Ln
- 1411 Riggs Mill Ln
- 307 Royal Fern Ln
- 301 Royal Fern Ln
- 1507 Country Walk Dr
- 474 Sandbar Ln
- 472 Sandbar Ln
- 470 Sandbar Ln
- 467 Sandbar Ln
- 469 Sandbar Ln
- 464 Sandbar Ln
- 466 Sandbar Ln
- 222 Aunt Bee Blvd
- 135 Avalon Trace Unit LOT 18
- 468 Sandbar Ln
- 214 Surrey Ln
- 1807 Cypress Lake Rd
- 1781 Cypress Lake Rd
- 2031 Cypress Lake Rd
- 1901 Cypress Lake Rd
- 1921 Cypress Lake Rd
- 1953 Cypress Lake Rd
- 1971 Cypress Lake Rd
- 2887 Cypress Lake Rd
- 2885 Cypress Lake Rd
- 2886 Cypress Lake Rd
- 1989 Cypress Lake Rd
- 311 Cypress Lake Ln
- 309 Cypress Lake Rd
- 123 Cypress Lake Dr
- 127 Cypress Lake Dr
- 203 Cypress Lake Ct
- 203 Cypress Lake Ct
- 305 Cypress Lake Ln
- 2292 Cypress Lake Rd
- 123 SW Cypress Lake Ln