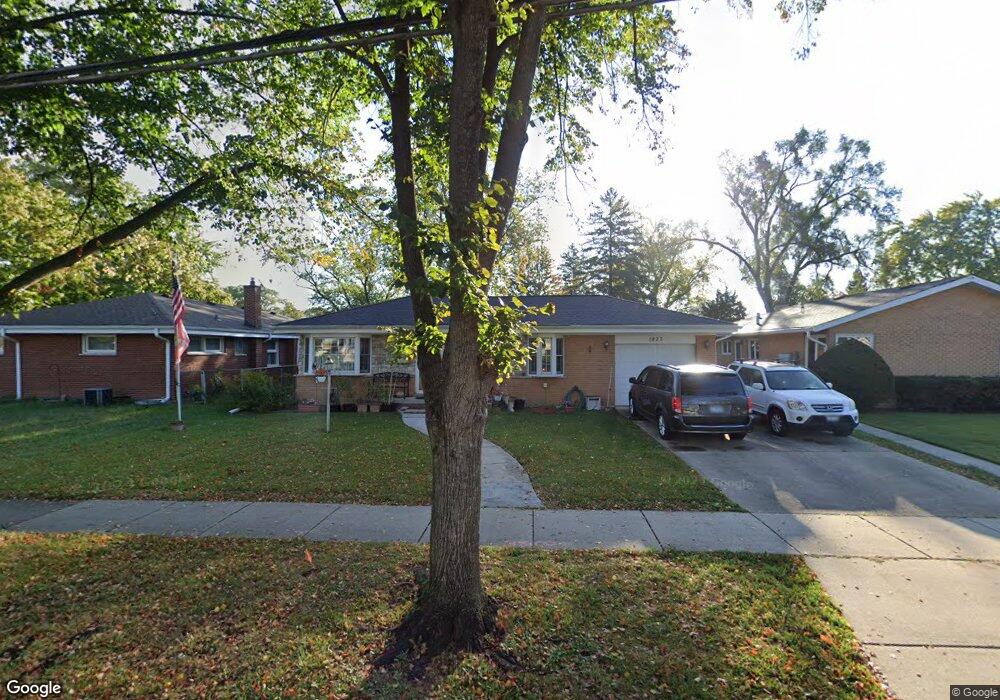
1823 Maple St Unit 305 Des Plaines, IL 60018
Estimated Value: $207,000 - $222,873
2
Beds
--
Bath
1,172
Sq Ft
$183/Sq Ft
Est. Value
About This Home
This home is located at 1823 Maple St Unit 305, Des Plaines, IL 60018 and is currently estimated at $214,968, approximately $183 per square foot. 1823 Maple St Unit 305 is a home located in Cook County with nearby schools including South Elementary School, Algonquin Middle School, and Maine West High School.
Ownership History
Date
Name
Owned For
Owner Type
Purchase Details
Closed on
May 23, 2022
Sold by
Zmuda Mateusz and Zmuda Beata
Bought by
Pearson Tyler
Current Estimated Value
Home Financials for this Owner
Home Financials are based on the most recent Mortgage that was taken out on this home.
Original Mortgage
$183,330
Outstanding Balance
$174,025
Interest Rate
5.63%
Mortgage Type
New Conventional
Estimated Equity
$40,943
Purchase Details
Closed on
Sep 19, 2003
Sold by
Kozuch Ryszard and Kozuch Bogdan
Bought by
Zmuda Mateusz
Home Financials for this Owner
Home Financials are based on the most recent Mortgage that was taken out on this home.
Original Mortgage
$110,000
Interest Rate
6.49%
Mortgage Type
Purchase Money Mortgage
Purchase Details
Closed on
Feb 28, 1997
Sold by
Rice Robert R and Rice Colette T
Bought by
Kozuch Ryszard and Kozuch Bogdan
Home Financials for this Owner
Home Financials are based on the most recent Mortgage that was taken out on this home.
Original Mortgage
$63,000
Interest Rate
7.93%
Mortgage Type
Purchase Money Mortgage
Create a Home Valuation Report for This Property
The Home Valuation Report is an in-depth analysis detailing your home's value as well as a comparison with similar homes in the area
Home Values in the Area
Average Home Value in this Area
Purchase History
| Date | Buyer | Sale Price | Title Company |
|---|---|---|---|
| Pearson Tyler | $189,000 | Saturn Title | |
| Zmuda Mateusz | $165,500 | Stewart Title | |
| Kozuch Ryszard | $90,000 | -- |
Source: Public Records
Mortgage History
| Date | Status | Borrower | Loan Amount |
|---|---|---|---|
| Open | Pearson Tyler | $183,330 | |
| Previous Owner | Zmuda Mateusz | $110,000 | |
| Previous Owner | Kozuch Ryszard | $63,000 |
Source: Public Records
Tax History
| Year | Tax Paid | Tax Assessment Tax Assessment Total Assessment is a certain percentage of the fair market value that is determined by local assessors to be the total taxable value of land and additions on the property. | Land | Improvement |
|---|---|---|---|---|
| 2025 | $2,715 | $20,010 | $3,299 | $16,711 |
| 2024 | $2,715 | $14,034 | $2,828 | $11,206 |
| 2023 | $2,571 | $14,034 | $2,828 | $11,206 |
| 2022 | $2,571 | $14,034 | $2,828 | $11,206 |
| 2021 | $1,992 | $10,500 | $1,885 | $8,615 |
| 2020 | $2,010 | $10,500 | $1,885 | $8,615 |
| 2019 | $2,052 | $11,731 | $1,885 | $9,846 |
| 2018 | $1,077 | $7,289 | $1,570 | $5,719 |
| 2017 | $1,074 | $7,289 | $1,570 | $5,719 |
| 2016 | $1,237 | $7,289 | $1,570 | $5,719 |
| 2015 | $1,661 | $8,650 | $1,413 | $7,237 |
| 2014 | $1,657 | $8,650 | $1,413 | $7,237 |
| 2013 | $1,237 | $6,477 | $1,413 | $5,064 |
Source: Public Records
Map
Nearby Homes
- 1721 Prospect Ave
- 1640 S River Rd
- 1922 Fargo Ave
- 1645 Illinois St
- 1689 S Elm St
- 1445 Everett Ave
- 1696 S Elm St
- 1990 Berry Ln
- 1700 E Forest Ave
- 1370 Fargo Ave Unit E
- 2220 S Chestnut St
- 1641 E Touhy Ave
- 1629 E Touhy Ave
- 38 E Touhy Ave
- 700 Florence Dr
- 2469 Parkwood Ln
- 1630 Henry Ave
- 2600 S Scott St
- 1080 Bogart St
- 2609 Eisenhower Dr
- 1823 Maple St
- 1811 Everett Ave
- 1831 Maple St
- 1839 Maple St
- 1820 Locust St
- 1830 Locust St
- 1818 Maple St
- 1808 Maple St
- 1845 Maple St
- 1830 Maple St
- 1810 Everett Ave
- 1838 Locust St Unit B
- 1834 Maple St
- 1844 Locust St
- 1784 Everett Ave
- 1784 Everett Ave
- 1855 Maple St Unit B
- 1844 Everett Ave
- 1785 Maple St
- 1846 Maple St
Your Personal Tour Guide
Ask me questions while you tour the home.