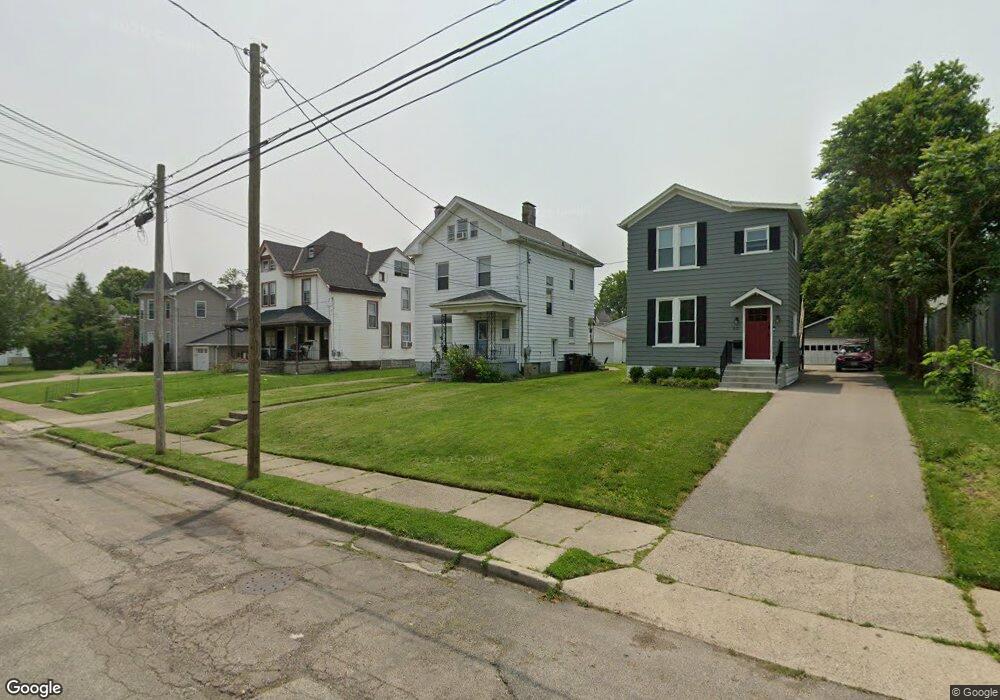
1823 Mentor Ave Cincinnati, OH 45212
Estimated Value: $230,968 - $361,000
5
Beds
2
Baths
1,488
Sq Ft
$203/Sq Ft
Est. Value
About This Home
This home is located at 1823 Mentor Ave, Cincinnati, OH 45212 and is currently estimated at $302,492, approximately $203 per square foot. 1823 Mentor Ave is a home located in Hamilton County with nearby schools including Norwood High School, Alliance Academy of Cincinnati, and Cornerstone Christian Academy.
Ownership History
Date
Name
Owned For
Owner Type
Purchase Details
Closed on
Nov 9, 2025
Sold by
Crable Peter Joseph
Bought by
1823 Mentor Llc
Current Estimated Value
Purchase Details
Closed on
Feb 28, 2013
Sold by
Ruhenkamp Dave and Ruhenkamp Lisa
Bought by
Crable Peter Joseph
Home Financials for this Owner
Home Financials are based on the most recent Mortgage that was taken out on this home.
Original Mortgage
$108,800
Interest Rate
3.49%
Mortgage Type
New Conventional
Purchase Details
Closed on
Feb 13, 2009
Sold by
Hannon Jeffrey K and Hannon Janet L
Bought by
Ruhenkamp Dave and Runhenkamp Lisa
Purchase Details
Closed on
Jan 20, 1994
Sold by
Bingham Paul and Bingham Wanda Lee
Bought by
Hannon Jeffrey K and Hannon Janet L
Home Financials for this Owner
Home Financials are based on the most recent Mortgage that was taken out on this home.
Original Mortgage
$87,300
Interest Rate
7.26%
Create a Home Valuation Report for This Property
The Home Valuation Report is an in-depth analysis detailing your home's value as well as a comparison with similar homes in the area
Home Values in the Area
Average Home Value in this Area
Purchase History
| Date | Buyer | Sale Price | Title Company |
|---|---|---|---|
| 1823 Mentor Llc | -- | None Listed On Document | |
| Crable Peter Joseph | $136,000 | Attorney | |
| Ruhenkamp Dave | $139,000 | Prodigy Title Agency | |
| Hannon Jeffrey K | -- | -- |
Source: Public Records
Mortgage History
| Date | Status | Borrower | Loan Amount |
|---|---|---|---|
| Previous Owner | Crable Peter Joseph | $108,800 | |
| Previous Owner | Hannon Jeffrey K | $87,300 |
Source: Public Records
Tax History
| Year | Tax Paid | Tax Assessment Tax Assessment Total Assessment is a certain percentage of the fair market value that is determined by local assessors to be the total taxable value of land and additions on the property. | Land | Improvement |
|---|---|---|---|---|
| 2025 | $2,842 | $53,270 | $12,187 | $41,083 |
| 2024 | $2,843 | $53,270 | $12,187 | $41,083 |
| 2023 | $2,859 | $53,270 | $12,187 | $41,083 |
| 2022 | $2,318 | $36,369 | $8,183 | $28,186 |
| 2021 | $2,294 | $36,369 | $8,183 | $28,186 |
| 2020 | $2,244 | $36,369 | $8,183 | $28,186 |
| 2019 | $2,140 | $31,903 | $7,179 | $24,724 |
| 2018 | $2,142 | $31,903 | $7,179 | $24,724 |
| 2017 | $2,051 | $31,903 | $7,179 | $24,724 |
| 2016 | $3,197 | $47,600 | $6,748 | $40,852 |
| 2015 | $2,825 | $47,600 | $6,748 | $40,852 |
| 2014 | $2,814 | $47,600 | $6,748 | $40,852 |
| 2013 | $2,716 | $48,651 | $7,179 | $41,472 |
Source: Public Records
Map
Nearby Homes
- 1820 Wayland Ave
- 4005 Ivanhoe Ave
- 1930 Hudson Ave
- 1931 Waverly Ave
- 1839 Hopkins Ave
- 4108 Montgomery Rd
- 2010 Hopkins Ave
- 3950 Elsmere Ave
- 4206 Lafayette Ave
- 3628 Bevis Ave
- 3929 Hazel Ave
- 3629 Evanston Ave
- 1932 Clarion Ave
- 2014 Clarion Ave
- 3572 Bevis Ave
- 2241 Cameron Ave
- 3568 Bevis Ave
- 3625 Newton Ave
- 3615 Newton Ave
- 1841 Mills Ave
- 1821 Mentor Ave
- 1825 Mentor Ave
- 1831 Mentor Ave
- 3911 Ivanhoe Ave
- 1824 Wayland Ave
- 3909 Ivanhoe Ave
- 1820 Mentor Ave
- 1818 Wayland Ave
- 1814 Wayland Ave
- 1816 Wayland Ave
- 1812 Wayland Ave
- 1834 Wayland Ave
- 1822 Mentor Ave
- 1818 Mentor Ave
- 1836 Wayland Ave
- 1810 Wayland Ave
- 1826 Mentor Ave
- 1810 Mentor Ave
- 1808 Wayland Ave
- 1901 Mentor Ave
Your Personal Tour Guide
Ask me questions while you tour the home.