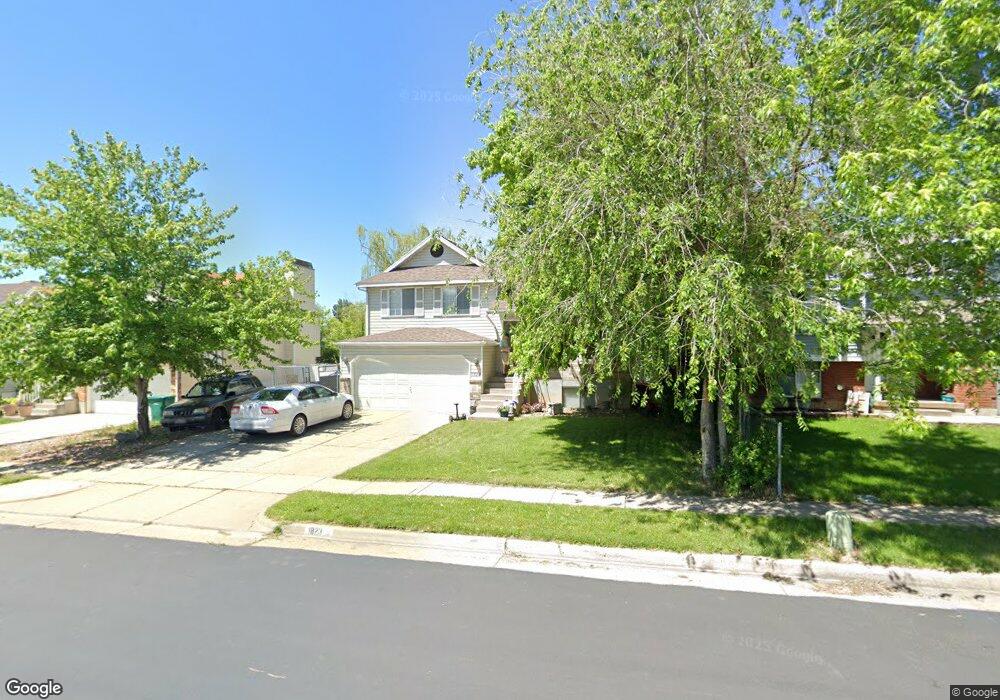
1823 N 285 W Layton, UT 84041
Estimated Value: $416,000 - $449,000
4
Beds
2
Baths
2,083
Sq Ft
$211/Sq Ft
Est. Value
About This Home
This home is located at 1823 N 285 W, Layton, UT 84041 and is currently estimated at $439,812, approximately $211 per square foot. 1823 N 285 W is a home located in Davis County with nearby schools including Lincoln Elementary School, North Layton Junior High School, and Northridge High School.
Ownership History
Date
Name
Owned For
Owner Type
Purchase Details
Closed on
Dec 16, 2020
Sold by
Nelson Brian and Nelson Shelbi
Bought by
Hopper Robert G and Hopper Brittany L
Current Estimated Value
Home Financials for this Owner
Home Financials are based on the most recent Mortgage that was taken out on this home.
Original Mortgage
$327,750
Outstanding Balance
$291,122
Interest Rate
2.7%
Mortgage Type
New Conventional
Estimated Equity
$148,690
Purchase Details
Closed on
May 26, 2004
Sold by
Thomas David G and Thomas Sheila
Bought by
Nelson Brian and Nelson Shelbi
Home Financials for this Owner
Home Financials are based on the most recent Mortgage that was taken out on this home.
Original Mortgage
$134,500
Interest Rate
7.99%
Mortgage Type
Purchase Money Mortgage
Purchase Details
Closed on
Dec 29, 1995
Sold by
Nelson Mark A
Bought by
Thomas David G and Thomas Sheila
Home Financials for this Owner
Home Financials are based on the most recent Mortgage that was taken out on this home.
Original Mortgage
$102,360
Interest Rate
7.36%
Mortgage Type
FHA
Create a Home Valuation Report for This Property
The Home Valuation Report is an in-depth analysis detailing your home's value as well as a comparison with similar homes in the area
Home Values in the Area
Average Home Value in this Area
Purchase History
| Date | Buyer | Sale Price | Title Company |
|---|---|---|---|
| Hopper Robert G | -- | Cottonwood Title Ins | |
| Nelson Brian | -- | Title West Title Company | |
| Thomas David G | -- | Us Title |
Source: Public Records
Mortgage History
| Date | Status | Borrower | Loan Amount |
|---|---|---|---|
| Open | Hopper Robert G | $327,750 | |
| Previous Owner | Nelson Brian | $134,500 | |
| Previous Owner | Thomas David G | $102,360 |
Source: Public Records
Tax History Compared to Growth
Tax History
| Year | Tax Paid | Tax Assessment Tax Assessment Total Assessment is a certain percentage of the fair market value that is determined by local assessors to be the total taxable value of land and additions on the property. | Land | Improvement |
|---|---|---|---|---|
| 2025 | $1,961 | $215,050 | $92,349 | $122,701 |
| 2024 | $1,961 | $207,350 | $108,159 | $99,191 |
| 2023 | $1,964 | $366,000 | $133,835 | $232,165 |
| 2022 | $2,032 | $205,700 | $69,182 | $136,518 |
| 2021 | $1,881 | $284,000 | $92,997 | $191,003 |
| 2020 | $1,671 | $242,000 | $79,934 | $162,066 |
| 2019 | $1,650 | $234,000 | $77,485 | $156,515 |
| 2018 | $1,468 | $209,000 | $77,485 | $131,515 |
| 2016 | $1,374 | $100,926 | $23,656 | $77,270 |
| 2015 | $1,311 | $91,411 | $23,656 | $67,755 |
| 2014 | $1,237 | $88,233 | $23,656 | $64,577 |
| 2013 | -- | $86,972 | $22,179 | $64,793 |
Source: Public Records
Map
Nearby Homes
- 247 W 1925 N
- 1837 N 440 W
- 1644 N 160 W
- 1966 N 50 W
- 2044 Evans Cove Loop
- 2048 Evans Cove Loop
- 1676 Forbes Ave W
- 1490 N 175 W
- 2187 N 450 W
- 2211 N 525 W
- 160 W 1350 N
- 2248 N 500 W
- 23 E 2150 N
- 1553 N 250 E
- 255 E 1500 N
- 1474 N 285 E
- 1131 N 150 W
- 2378 N 675 W
- 2500 N Fort Ln Unit 238
- 2500 N Fort Ln Unit 189