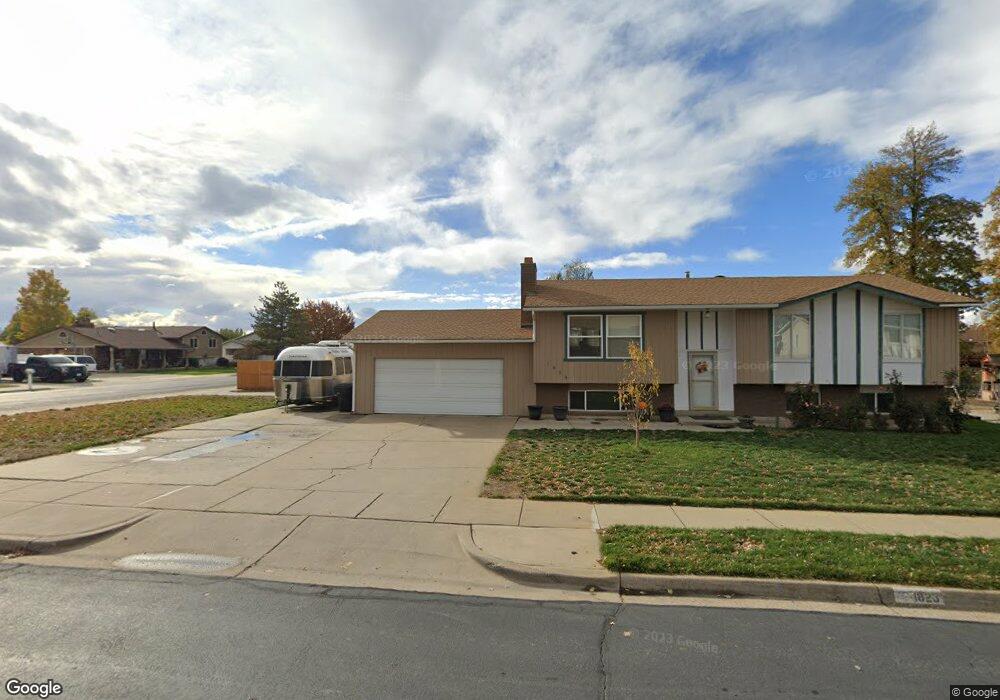
1823 N 725 W West Bountiful, UT 84087
Estimated Value: $487,000 - $539,000
3
Beds
2
Baths
1,137
Sq Ft
$454/Sq Ft
Est. Value
About This Home
This home is located at 1823 N 725 W, West Bountiful, UT 84087 and is currently estimated at $515,829, approximately $453 per square foot. 1823 N 725 W is a home located in Davis County with nearby schools including West Bountiful Elementary School, Bountiful Junior High School, and Viewmont High School.
Create a Home Valuation Report for This Property
The Home Valuation Report is an in-depth analysis detailing your home's value as well as a comparison with similar homes in the area
Home Values in the Area
Average Home Value in this Area
Tax History Compared to Growth
Tax History
| Year | Tax Paid | Tax Assessment Tax Assessment Total Assessment is a certain percentage of the fair market value that is determined by local assessors to be the total taxable value of land and additions on the property. | Land | Improvement |
|---|---|---|---|---|
| 2025 | $2,682 | $252,450 | $142,726 | $109,724 |
| 2024 | $2,655 | $254,650 | $117,651 | $136,999 |
| 2023 | $2,554 | $446,000 | $220,549 | $225,451 |
| 2022 | $2,624 | $255,200 | $107,392 | $147,808 |
| 2021 | $2,348 | $351,000 | $147,895 | $203,105 |
| 2020 | $2,003 | $297,000 | $134,847 | $162,153 |
| 2019 | $1,976 | $288,000 | $134,197 | $153,803 |
| 2018 | $1,861 | $267,000 | $131,566 | $135,434 |
| 2016 | $1,614 | $123,475 | $37,219 | $86,256 |
| 2015 | $1,564 | $113,080 | $37,219 | $75,861 |
| 2014 | $1,455 | $107,566 | $37,219 | $70,347 |
| 2013 | -- | $100,915 | $29,404 | $71,511 |
Source: Public Records
Map
Nearby Homes