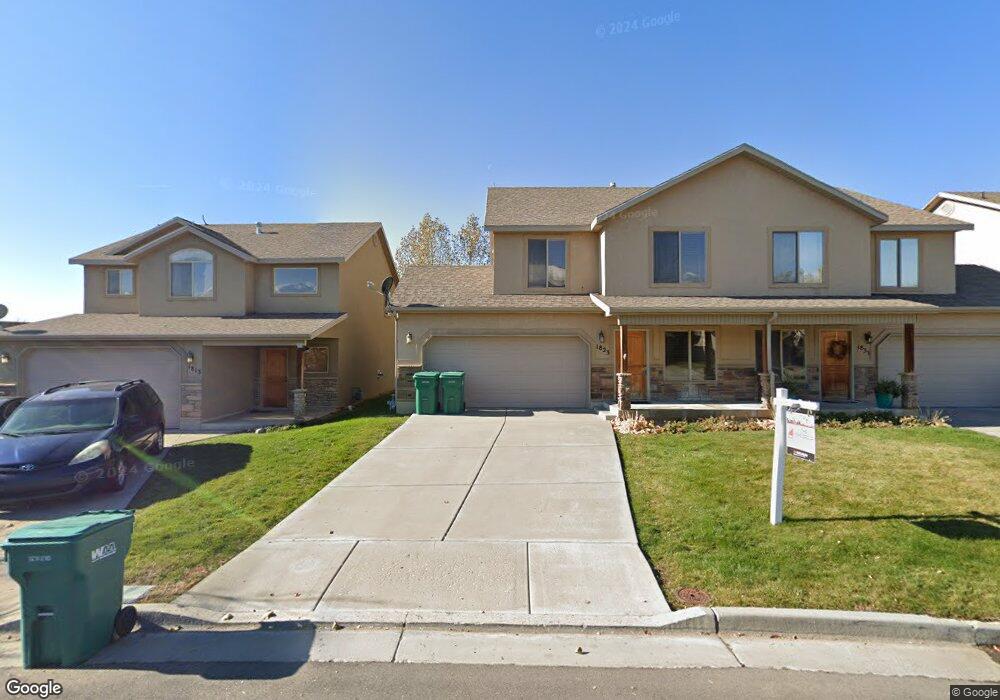
1823 N Belvedere Way Layton, UT 84041
Estimated Value: $389,000 - $428,000
4
Beds
3
Baths
1,756
Sq Ft
$230/Sq Ft
Est. Value
About This Home
This home is located at 1823 N Belvedere Way, Layton, UT 84041 and is currently estimated at $404,750, approximately $230 per square foot. 1823 N Belvedere Way is a home located in Davis County with nearby schools including Lincoln Elementary School, North Layton Junior High School, and Northridge High School.
Ownership History
Date
Name
Owned For
Owner Type
Purchase Details
Closed on
Feb 9, 2023
Sold by
Fong Wai Richard L
Bought by
Wall Kiara
Current Estimated Value
Purchase Details
Closed on
Aug 15, 2006
Sold by
Scott Lindsay Construction Inc
Bought by
Fong Wai Richard L
Purchase Details
Closed on
Dec 5, 2005
Sold by
Higley Justin and Cater Rick A
Bought by
Scott Lindsay Construction Inc
Home Financials for this Owner
Home Financials are based on the most recent Mortgage that was taken out on this home.
Original Mortgage
$139,200
Interest Rate
6.14%
Mortgage Type
Purchase Money Mortgage
Create a Home Valuation Report for This Property
The Home Valuation Report is an in-depth analysis detailing your home's value as well as a comparison with similar homes in the area
Home Values in the Area
Average Home Value in this Area
Purchase History
| Date | Buyer | Sale Price | Title Company |
|---|---|---|---|
| Wall Kiara | -- | -- | |
| Fong Wai Richard L | -- | Security Title | |
| Scott Lindsay Construction Inc | -- | Heritage West Title Ins Agen | |
| Higley Justin | -- | Heritage West Title Ins Agen |
Source: Public Records
Mortgage History
| Date | Status | Borrower | Loan Amount |
|---|---|---|---|
| Previous Owner | Scott Lindsay Construction Inc | $139,200 |
Source: Public Records
Tax History Compared to Growth
Tax History
| Year | Tax Paid | Tax Assessment Tax Assessment Total Assessment is a certain percentage of the fair market value that is determined by local assessors to be the total taxable value of land and additions on the property. | Land | Improvement |
|---|---|---|---|---|
| 2025 | $1,907 | $200,200 | $68,200 | $132,000 |
| 2024 | $1,836 | $194,150 | $52,250 | $141,900 |
| 2023 | $1,958 | $365,000 | $91,000 | $274,000 |
| 2022 | $1,989 | $201,300 | $45,650 | $155,650 |
| 2021 | $1,881 | $284,000 | $69,000 | $215,000 |
| 2020 | $1,740 | $252,000 | $51,000 | $201,000 |
| 2019 | $1,756 | $249,000 | $49,000 | $200,000 |
| 2018 | $1,524 | $217,000 | $49,000 | $168,000 |
| 2016 | $1,376 | $101,090 | $26,950 | $74,140 |
| 2015 | $1,331 | $92,840 | $26,950 | $65,890 |
| 2014 | $1,377 | $98,216 | $18,333 | $79,883 |
| 2013 | -- | $82,765 | $13,701 | $69,064 |
Source: Public Records
Map
Nearby Homes
- 1908 N 200 W
- 2048 Evans Cove Loop
- 2053 Evans Cove Loop Unit 39
- 1583 N 25 E
- 398 Paul Ave
- 1490 N 175 W
- 1553 N 250 E
- 1715 N Alder St
- 538 W 1875 N
- 506 W 2200 N
- 2233 N 475 W
- 1474 N 285 E
- 2248 N 500 W
- 2211 N 525 W
- 103 W 1275 N
- 95 W 2400 N
- 324 E 1325 N
- 2500 N Fort Ln Unit 238
- 2149 N 750 W
- 2600 N Hill Field Rd Unit 108
- 1833 N Belvedere Way
- 1813 N Belvedere Way
- 1845 N Belvedere Way
- 1797 N Belvedere Way
- 1828 N 225 W
- 1818 N 225 W
- 1791 N Belvedere Way
- 1840 N 225 W
- 1834 N Belvedere Way
- 1834 N Belvedere Way Unit 53
- 1822 N Belvedere Way
- 1808 N 225 W
- 1787 N Belvedere Way
- 1844 N Belvedere Way
- 1798 N 225 W
- 1781 N Belvedere Way
- 1859 N 150 W
- 1780 N Belvedere Way
- 1780 N Belvedere Way
- 1780 N Belvedere Way Unit 113