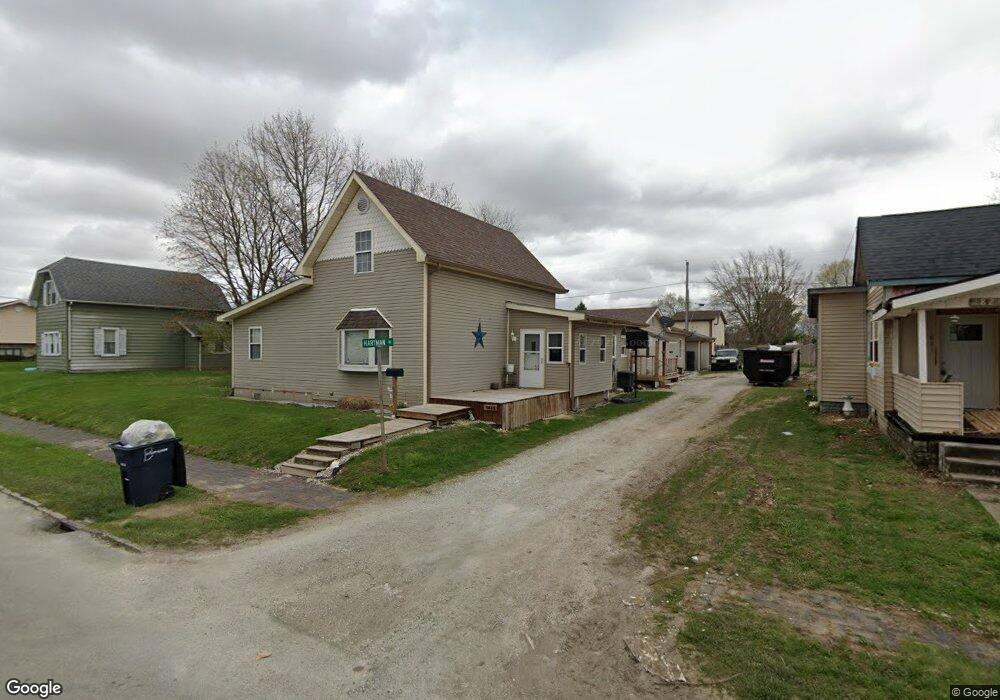
1823 N F St Elwood, IN 46036
Estimated Value: $146,000 - $223,000
6
Beds
2
Baths
2,959
Sq Ft
$63/Sq Ft
Est. Value
About This Home
This home is located at 1823 N F St, Elwood, IN 46036 and is currently estimated at $185,537, approximately $62 per square foot. 1823 N F St is a home located in Madison County with nearby schools including Elwood Elementary School, Elwood Intermediate School, and Elwood Junior-Senior High School.
Ownership History
Date
Name
Owned For
Owner Type
Purchase Details
Closed on
Jul 12, 2011
Sold by
Secretary Of Hud
Bought by
Hartman Gregory G and Hartman Peggy S
Current Estimated Value
Home Financials for this Owner
Home Financials are based on the most recent Mortgage that was taken out on this home.
Original Mortgage
$41,662
Outstanding Balance
$28,779
Interest Rate
4.75%
Mortgage Type
FHA
Estimated Equity
$156,758
Purchase Details
Closed on
Jan 13, 2010
Sold by
Fifth Third Mortgage Company
Bought by
Secretary Of Hud
Purchase Details
Closed on
Dec 11, 2009
Sold by
Harden Raylene S and Harden M N
Bought by
Fifth Third Mortgage Co
Purchase Details
Closed on
May 18, 2006
Sold by
Backer Mary Roseann and Backer Mary Rosann
Bought by
Harden Raylene S and Harden Joan M
Home Financials for this Owner
Home Financials are based on the most recent Mortgage that was taken out on this home.
Original Mortgage
$98,356
Interest Rate
6.68%
Mortgage Type
FHA
Create a Home Valuation Report for This Property
The Home Valuation Report is an in-depth analysis detailing your home's value as well as a comparison with similar homes in the area
Home Values in the Area
Average Home Value in this Area
Purchase History
| Date | Buyer | Sale Price | Title Company |
|---|---|---|---|
| Hartman Gregory G | -- | -- | |
| Secretary Of Hud | -- | -- | |
| Fifth Third Mortgage Co | $120,622 | -- | |
| Harden Raylene S | -- | -- |
Source: Public Records
Mortgage History
| Date | Status | Borrower | Loan Amount |
|---|---|---|---|
| Open | Hartman Gregory G | $41,662 | |
| Previous Owner | Harden Raylene S | $98,356 |
Source: Public Records
Tax History Compared to Growth
Tax History
| Year | Tax Paid | Tax Assessment Tax Assessment Total Assessment is a certain percentage of the fair market value that is determined by local assessors to be the total taxable value of land and additions on the property. | Land | Improvement |
|---|---|---|---|---|
| 2025 | $1,045 | $104,500 | $11,100 | $93,400 |
| 2024 | $1,045 | $104,500 | $11,100 | $93,400 |
| 2023 | $975 | $95,900 | $10,600 | $85,300 |
| 2022 | $909 | $90,700 | $9,800 | $80,900 |
| 2021 | $805 | $81,300 | $9,600 | $71,700 |
| 2020 | $752 | $75,000 | $8,900 | $66,100 |
| 2019 | $734 | $73,200 | $8,900 | $64,300 |
| 2018 | $722 | $69,600 | $8,900 | $60,700 |
| 2017 | $706 | $69,000 | $8,900 | $60,100 |
| 2016 | $693 | $68,100 | $8,700 | $59,400 |
| 2014 | $655 | $69,500 | $8,900 | $60,600 |
| 2013 | $655 | $69,900 | $8,900 | $61,000 |
Source: Public Records
Map
Nearby Homes