Estimated Value: $245,443 - $297,000
2
Beds
2
Baths
1,445
Sq Ft
$184/Sq Ft
Est. Value
About This Home
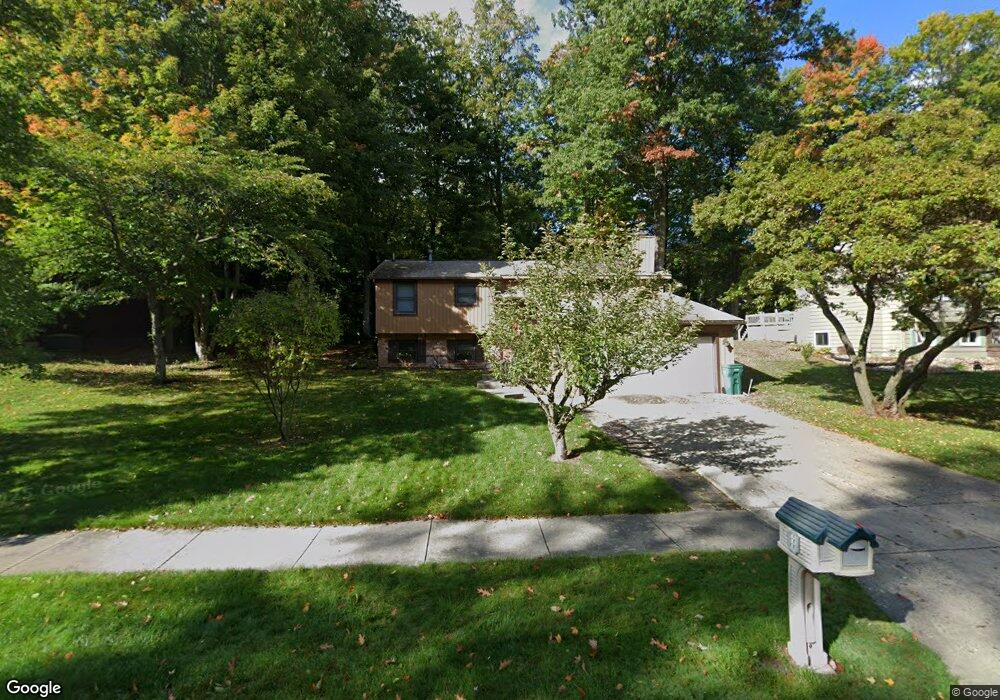
This home is located at 1823 Pageant Way, Holt, MI 48842 and is currently estimated at $265,861, approximately $183 per square foot. 1823 Pageant Way is a home located in Ingham County with nearby schools including Wilcox Elementary School, Holt Junior High School, and Washington Woods Middle School.
Ownership History
Date
Name
Owned For
Owner Type
Purchase Details
Closed on
Jun 16, 2008
Sold by
Musgrove Roy L
Bought by
Musgrove Roy L and Keating Kay Ann
Current Estimated Value
Purchase Details
Closed on
May 8, 2008
Sold by
Musgrove Roy L
Bought by
Musgrove Roy L
Purchase Details
Closed on
Mar 21, 2002
Sold by
Jones Bruce J and Jones Kristyn K
Bought by
Mathews Dale W and Mathews Joyce
Home Financials for this Owner
Home Financials are based on the most recent Mortgage that was taken out on this home.
Original Mortgage
$109,600
Outstanding Balance
$45,009
Interest Rate
6.82%
Mortgage Type
Purchase Money Mortgage
Estimated Equity
$220,852
Purchase Details
Closed on
Jan 5, 2001
Sold by
Brown Larry A and Brown Billie A
Bought by
Jones Bruce J and Jones Kristyn K
Home Financials for this Owner
Home Financials are based on the most recent Mortgage that was taken out on this home.
Original Mortgage
$122,200
Interest Rate
7.69%
Mortgage Type
Purchase Money Mortgage
Create a Home Valuation Report for This Property
The Home Valuation Report is an in-depth analysis detailing your home's value as well as a comparison with similar homes in the area
Home Values in the Area
Average Home Value in this Area
Purchase History
| Date | Buyer | Sale Price | Title Company |
|---|---|---|---|
| Musgrove Roy L | -- | None Available | |
| Musgrove Roy L | -- | None Available | |
| Mathews Dale W | $137,000 | -- | |
| Jones Bruce J | $128,650 | -- |
Source: Public Records
Mortgage History
| Date | Status | Borrower | Loan Amount |
|---|---|---|---|
| Open | Mathews Dale W | $109,600 | |
| Previous Owner | Jones Bruce J | $122,200 |
Source: Public Records
Tax History Compared to Growth
Tax History
| Year | Tax Paid | Tax Assessment Tax Assessment Total Assessment is a certain percentage of the fair market value that is determined by local assessors to be the total taxable value of land and additions on the property. | Land | Improvement |
|---|---|---|---|---|
| 2025 | $4,023 | $115,900 | $25,000 | $90,900 |
| 2024 | $3,805 | $113,200 | $25,000 | $88,200 |
| 2023 | $3,805 | $102,100 | $18,700 | $83,400 |
| 2022 | $3,636 | $92,400 | $18,700 | $73,700 |
| 2021 | $3,562 | $84,600 | $14,300 | $70,300 |
| 2020 | $3,602 | $80,000 | $14,300 | $65,700 |
| 2019 | $3,492 | $79,900 | $12,900 | $67,000 |
| 2018 | $3,472 | $78,500 | $12,900 | $65,600 |
| 2017 | $3,167 | $78,500 | $12,900 | $65,600 |
| 2016 | $3,140 | $74,700 | $13,600 | $61,100 |
| 2015 | $3,111 | $69,700 | $27,199 | $42,501 |
| 2014 | $3,111 | $61,800 | $27,199 | $34,601 |
Source: Public Records
Map
Nearby Homes
- 1812 Tupelo Trail
- 4592 Holt Rd
- 2097 Jefferson St
- 0 Aurelius Rd Unit 282659
- 1535 Thimbleberry Dr
- 1532 N Eifert Rd
- 5071 Haddon Hall Dr
- 1947 Maple St
- 1942 Walnut St
- 4641 Tolland Ave
- 4662 Tolland Ave
- 4344 Willesdon Ave
- 4445 North St
- VL Witherspoon Way
- 4535 Garden Gate Unit 21
- 1511 Antler Cir
- 2201 Bertha St
- 4786 Harper Rd
- 2106 Coolridge Rd
- 1596 Berkley Dr
- 1839 Pageant Way
- 1815 Pageant Way
- 1851 Pageant Way
- 1807 Pageant Way
- 1822 Pageant Way
- 1816 Pageant Way
- 1830 Pageant Way
- 1808 Pageant Way
- 1863 Pageant Way
- 1842 Pageant Way
- 1801 Pageant Way
- 1856 Heatherton Dr
- 1825 Hamilton St
- 1833 Hamilton St
- 1817 Hamilton St
- 1789 Pageant Way
- 1854 Pageant Way
- 1866 Heatherton Dr
- 1841 Hamilton St