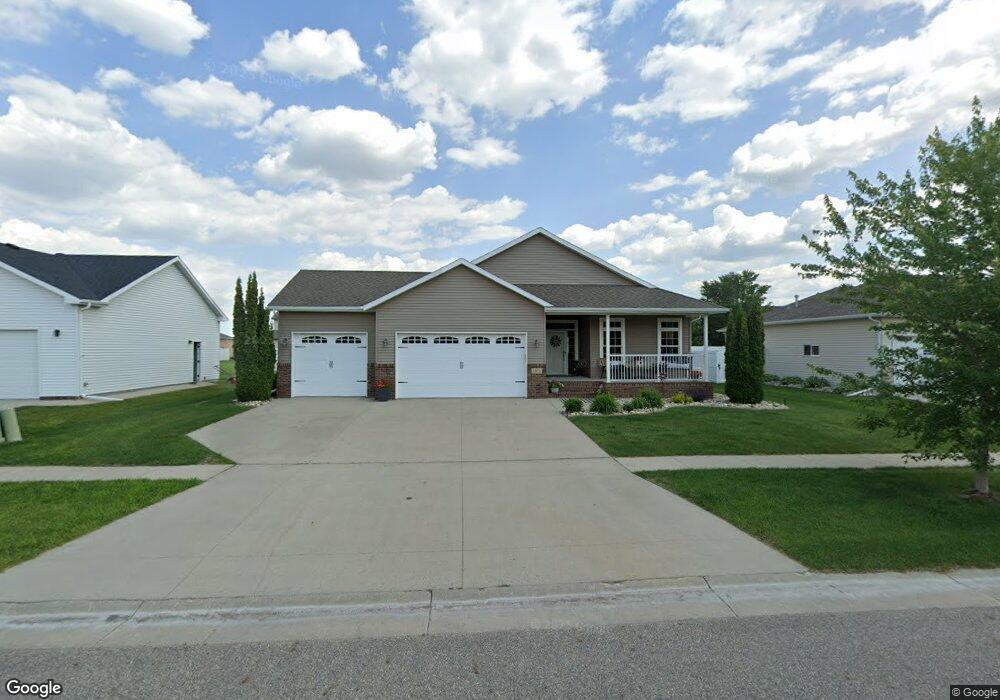
1823 Queensbury St West Fargo, ND 58078
Charleswood NeighborhoodEstimated Value: $461,000 - $540,000
2
Beds
2
Baths
1,548
Sq Ft
$328/Sq Ft
Est. Value
About This Home
This home is located at 1823 Queensbury St, West Fargo, ND 58078 and is currently estimated at $507,637, approximately $327 per square foot. 1823 Queensbury St is a home located in Cass County with nearby schools including South Elementary School, Cheney Middle School, and West Fargo High School.
Ownership History
Date
Name
Owned For
Owner Type
Purchase Details
Closed on
Nov 10, 2011
Sold by
Qvammen Bruce and Qvammen Marsha
Bought by
Welo Susan
Current Estimated Value
Home Financials for this Owner
Home Financials are based on the most recent Mortgage that was taken out on this home.
Original Mortgage
$248,535
Outstanding Balance
$168,244
Interest Rate
3.87%
Mortgage Type
FHA
Estimated Equity
$339,393
Purchase Details
Closed on
Jul 1, 2005
Sold by
Estoria Corp
Bought by
Qvammen Bruce and Qvammen Marsha
Create a Home Valuation Report for This Property
The Home Valuation Report is an in-depth analysis detailing your home's value as well as a comparison with similar homes in the area
Home Values in the Area
Average Home Value in this Area
Purchase History
| Date | Buyer | Sale Price | Title Company |
|---|---|---|---|
| Welo Susan | $255,000 | -- | |
| Qvammen Bruce | -- | -- |
Source: Public Records
Mortgage History
| Date | Status | Borrower | Loan Amount |
|---|---|---|---|
| Open | Welo Susan | $248,535 |
Source: Public Records
Tax History Compared to Growth
Tax History
| Year | Tax Paid | Tax Assessment Tax Assessment Total Assessment is a certain percentage of the fair market value that is determined by local assessors to be the total taxable value of land and additions on the property. | Land | Improvement |
|---|---|---|---|---|
| 2024 | $6,075 | $233,450 | $40,600 | $192,850 |
| 2023 | $6,197 | $217,800 | $40,600 | $177,200 |
| 2022 | $6,273 | $211,150 | $40,600 | $170,550 |
| 2021 | $5,934 | $192,000 | $36,350 | $155,650 |
| 2020 | $5,600 | $186,000 | $36,350 | $149,650 |
| 2019 | $5,387 | $184,950 | $36,350 | $148,600 |
| 2018 | $5,082 | $181,900 | $36,350 | $145,550 |
| 2017 | $5,390 | $183,500 | $36,350 | $147,150 |
| 2016 | $4,929 | $181,700 | $36,350 | $145,350 |
| 2015 | $4,741 | $159,000 | $25,050 | $133,950 |
| 2014 | $4,535 | $148,600 | $25,050 | $123,550 |
| 2013 | $4,618 | $148,600 | $25,050 | $123,550 |
Source: Public Records
Map
Nearby Homes
- 1815 Queensbury St
- 1831 Queensbury St
- 1826 Pentland St
- 1834 Pentland St
- 1818 Pentland St
- 1807 Queensbury St
- 1824 Queensbury St
- 1842 Pentland St
- 1810 Pentland St
- 1816 Queensbury St
- 1832 Queensbury St
- 1855 Queensbury St
- 1840 Queensbury St
- 1808 Queensbury St
- 1850 Pentland St
- 1848 Queensbury St
- 1863 Queensbury St
- 634 18th Ave E
- 1719 6th St E
- 1723 6th St E