1823 Royal Ct Aurora, IL 60503
Far Southeast NeighborhoodEstimated Value: $456,000 - $467,000
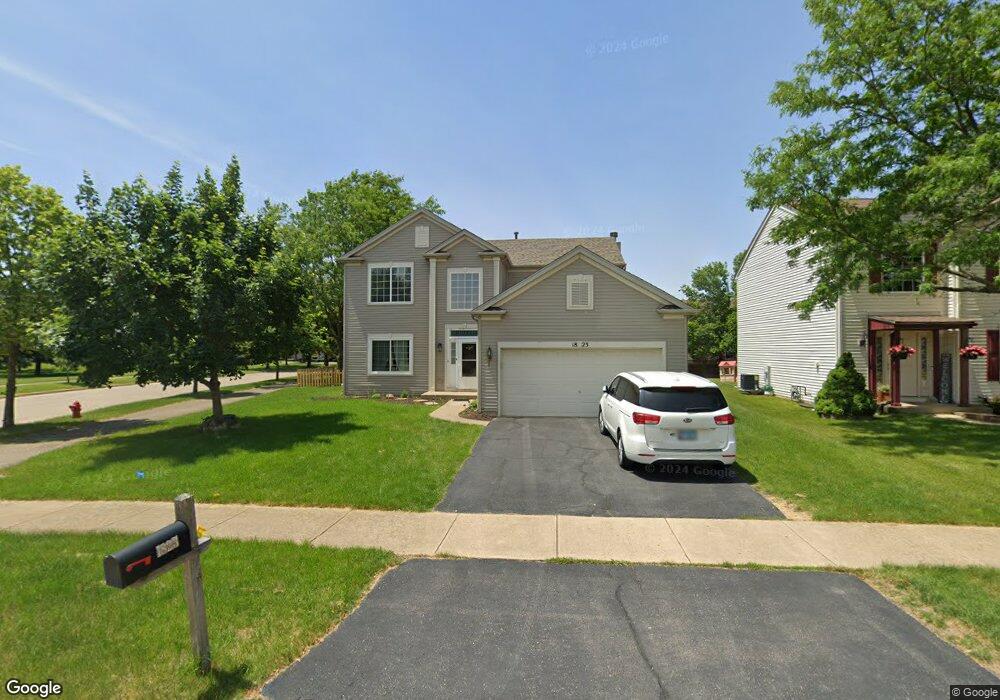
About This Home
This home is located at 1823 Royal Ct, Aurora, IL 60503 and is currently estimated at $460,952, approximately $198 per square foot. 1823 Royal Ct is a home located in Kendall County with nearby schools including The Wheatlands Elementary School, Bednarcik Jr. High School, and Oswego East High School.
Ownership History
We collect this data history from publicly available records. To have your information removed, we recommend requesting removal directly through your county’s website.
Purchase Details
Home Financials for this Owner
Home Financials are based on the most recent Mortgage that was taken out on this home.Purchase Details
Home Financials for this Owner
Home Financials are based on the most recent Mortgage that was taken out on this home.Home Values in the Area
Average Home Value in this Area
Purchase History
We collect this data history from publicly available records. To have your information removed, we recommend requesting removal directly through your county’s website.
| Date | Buyer | Sale Price | Title Company |
|---|---|---|---|
| $247,000 | American National Title Insu | ||
| $224,500 | Ticor Title Insurance |
Mortgage History
We collect this data history from publicly available records. To have your information removed, we recommend requesting removal directly through your county’s website.
| Date | Status | Borrower | Loan Amount |
|---|---|---|---|
| Open | $234,650 | ||
| Previous Owner | $190,563 |
Tax History
We collect this data history from publicly available records. To have your information removed, we recommend requesting removal directly through your county’s website.
| Year | Tax Paid | Tax Assessment Tax Assessment Total Assessment is a certain percentage of the fair market value that is determined by local assessors to be the total taxable value of land and additions on the property. | Land | Improvement |
|---|---|---|---|---|
| 2025 | $10,746 | $128,216 | $29,960 | $98,256 |
| 2024 | $10,746 | $126,946 | $29,663 | $97,283 |
| 2023 | $9,966 | $112,341 | $26,250 | $86,091 |
| 2022 | $9,966 | $104,992 | $24,533 | $80,459 |
| 2021 | $9,632 | $98,123 | $22,928 | $75,195 |
| 2020 | $9,543 | $96,199 | $22,478 | $73,721 |
| 2019 | $10,014 | $98,480 | $22,478 | $76,002 |
| 2018 | $9,751 | $90,308 | $20,613 | $69,695 |
| 2017 | $9,824 | $83,233 | $18,998 | $64,235 |
| 2016 | $4,733 | $78,894 | $18,008 | $60,886 |
| 2015 | $9,200 | $73,050 | $16,674 | $56,376 |
| 2014 | -- | $68,915 | $15,730 | $53,185 |
| 2013 | -- | $69,611 | $15,889 | $53,722 |
Map
- 1851 Wisteria Dr Unit 6
- 1874 Keating Dr
- 1871 Keating Dr
- 1868 Keating Dr
- 1866 Keating Dr
- 1862 Keating Dr
- 1859 Keating Dr
- 1858 Keating Dr
- 1855 Keating Dr
- 1869 Misty Ridge Ln Unit 4
- 1710 Baler Ave
- 1673 Baler Ave
- 1698 Baler Ave
- 1667 Baler Ave
- 1692 Baler Ave
- 1704 Baler Ave
- 1738 Baler Ave
- 1847 Baler Ave
- 1853 Baler Ave
- 1841 Baler Ave
- 1813 Royal Ct
- 1845 Ione Ln
- 1803 Royal Ct
- 1859 Ione Ln
- 1793 Royal Ct
- 1812 Royal Ct
- 1873 Ione Ln
- 1802 Royal Ct
- 1887 Ione Ln
- 1783 Royal Ct
- 1846 Wisteria Dr Unit 342
- 1862 Wisteria Dr Unit 346
- 1854 Wisteria Dr Unit 344
- 1858 Wisteria Dr Unit 345
- 1842 Wisteria Dr Unit 341
- 1792 Royal Ct
- 1861 Royal Ln
- 1835 Ione Ct
- 1845 Ione Ct
- 1862 Ione Ln
Ask me questions while you tour the home.