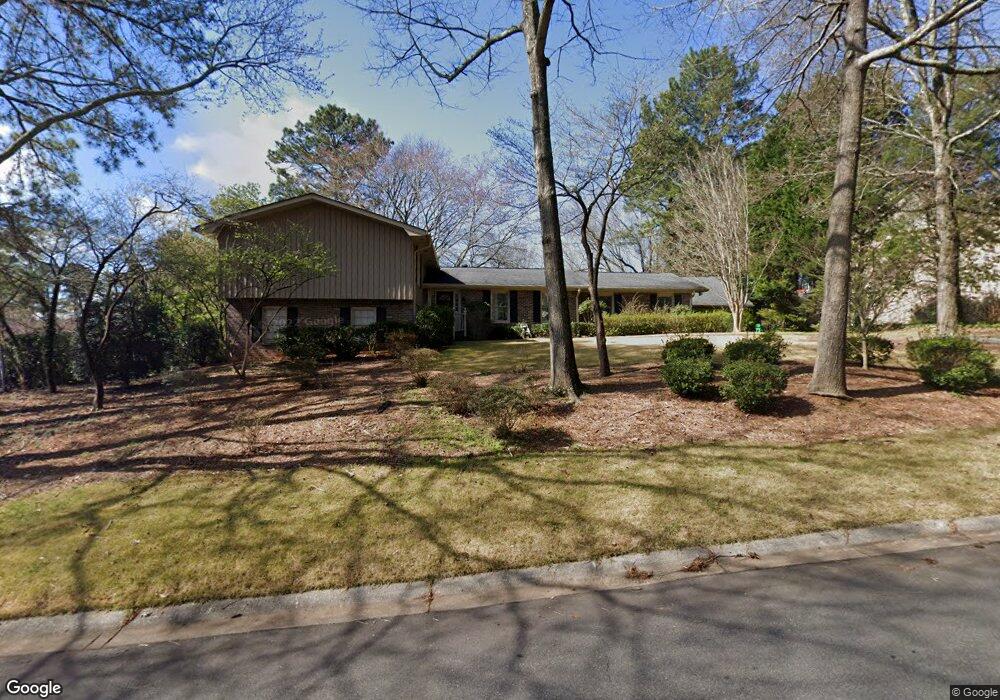
1823 Trumbull Dr Atlanta, GA 30338
Estimated Value: $722,713 - $819,000
4
Beds
4
Baths
3,172
Sq Ft
$246/Sq Ft
Est. Value
About This Home
This home is located at 1823 Trumbull Dr, Atlanta, GA 30338 and is currently estimated at $781,178, approximately $246 per square foot. 1823 Trumbull Dr is a home located in DeKalb County with nearby schools including Vanderlyn Elementary School, Peachtree Middle School, and Dunwoody High School.
Ownership History
Date
Name
Owned For
Owner Type
Purchase Details
Closed on
Dec 30, 2002
Sold by
Glover Thomas J and Glover Elizabeth L
Bought by
Sherman Cary M and Sherman Sandi
Current Estimated Value
Home Financials for this Owner
Home Financials are based on the most recent Mortgage that was taken out on this home.
Original Mortgage
$256,000
Outstanding Balance
$116,528
Interest Rate
5.99%
Mortgage Type
New Conventional
Estimated Equity
$664,650
Purchase Details
Closed on
Mar 31, 1999
Sold by
Narang Kulmeet S
Bought by
Glover Thomas J and Glover Elizabeth L
Home Financials for this Owner
Home Financials are based on the most recent Mortgage that was taken out on this home.
Original Mortgage
$190,600
Interest Rate
7.13%
Mortgage Type
New Conventional
Purchase Details
Closed on
Jul 29, 1994
Sold by
Danner Thomas A Anne C
Bought by
Narang Kulmet S
Home Financials for this Owner
Home Financials are based on the most recent Mortgage that was taken out on this home.
Original Mortgage
$120,000
Interest Rate
8.39%
Create a Home Valuation Report for This Property
The Home Valuation Report is an in-depth analysis detailing your home's value as well as a comparison with similar homes in the area
Home Values in the Area
Average Home Value in this Area
Purchase History
| Date | Buyer | Sale Price | Title Company |
|---|---|---|---|
| Sherman Cary M | $320,000 | -- | |
| Glover Thomas J | $238,300 | -- | |
| Narang Kulmet S | $163,400 | -- |
Source: Public Records
Mortgage History
| Date | Status | Borrower | Loan Amount |
|---|---|---|---|
| Open | Sherman Cary M | $256,000 | |
| Previous Owner | Glover Thomas J | $190,600 | |
| Previous Owner | Narang Kulmet S | $120,000 |
Source: Public Records
Tax History Compared to Growth
Tax History
| Year | Tax Paid | Tax Assessment Tax Assessment Total Assessment is a certain percentage of the fair market value that is determined by local assessors to be the total taxable value of land and additions on the property. | Land | Improvement |
|---|---|---|---|---|
| 2025 | $6,399 | $236,280 | $54,000 | $182,280 |
| 2024 | $6,277 | $224,600 | $54,000 | $170,600 |
| 2023 | $6,277 | $171,600 | $54,000 | $117,600 |
| 2022 | $4,900 | $171,600 | $54,000 | $117,600 |
| 2021 | $4,123 | $183,120 | $54,000 | $129,120 |
| 2020 | $4,228 | $144,840 | $54,000 | $90,840 |
| 2019 | $4,224 | $147,720 | $54,000 | $93,720 |
| 2018 | $4,560 | $146,720 | $39,560 | $107,160 |
| 2017 | $5,214 | $160,360 | $39,560 | $120,800 |
| 2016 | $4,662 | $146,120 | $39,560 | $106,560 |
| 2014 | $5,120 | $152,960 | $39,560 | $113,400 |
Source: Public Records
Map
Nearby Homes
- 5212 Falkirk Dr
- 1850 E Gate Cove
- 5271 Vernon Lake Dr
- 1611 Malfre Ln
- 4942 Lakeland Woods Ct
- 5346 Hallford Dr
- 1971 Wellesley Trace
- 1983 Wellesley Trace
- 5015 Oakhurst Walk
- 1933 Rotherham Way
- 5401 Seaton Way
- 4878 Leeds Ct
- 1691 Houghton Ct N
- 4906 Cambridge Dr
- 1566 Womack Rd
- 5437 Oxford Chase Way
- 5377 Trentham Dr
- 5417 Trentham Dr
- 5231 Seaton Dr
- 1811 Trumbull Dr
- 5158 Hensley Dr
- 5148 Hensley Dr
- 5138 Hensley Dr Unit I
- 5136 Trumbull Ct Unit 1
- 1801 Trumbull Dr
- 1814 Trumbull Dr
- 1840 Trumbull Dr Unit 1
- 5154 Trumbull Ct Unit 5154
- 5154 Trumbull Ct
- 5130 Hensley Dr
- 5161 Stratham Dr Unit 1
- 5159 Stratham Dr
- 0 Trumbull Ct Unit 7292692
- 0 Trumbull Ct
- 1848 Trumbull Dr
- 5137 Hensley Dr
- 5145 Hensley Dr
- 5155 Hensley Dr
- 5162 Trumbull Ct Unit 1