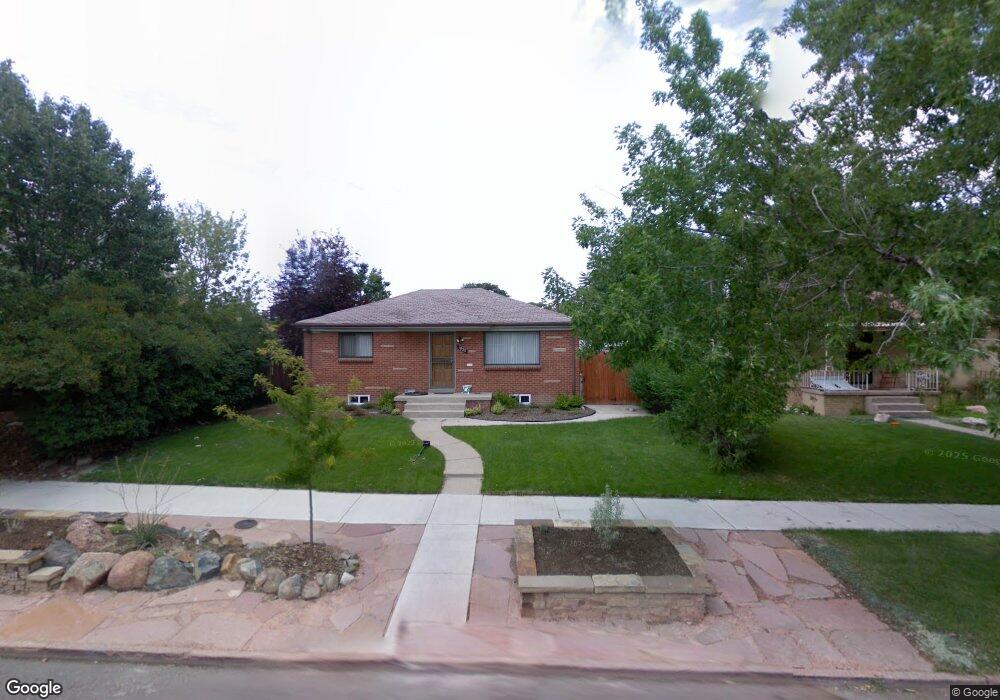
1823 W 39th Ave Denver, CO 80211
Sunnyside NeighborhoodEstimated Value: $762,000 - $845,000
4
Beds
2
Baths
1,826
Sq Ft
$435/Sq Ft
Est. Value
About This Home
This home is located at 1823 W 39th Ave, Denver, CO 80211 and is currently estimated at $795,010, approximately $435 per square foot. 1823 W 39th Ave is a home located in Denver County with nearby schools including Bryant Webster Dual Language School, Denver Montessori Junior/Senior High School, and Skinner Middle School.
Ownership History
Date
Name
Owned For
Owner Type
Purchase Details
Closed on
May 22, 2018
Sold by
Mcmahon Kate and Smith Lyman
Bought by
Penman Michelle and Coperberg David
Current Estimated Value
Home Financials for this Owner
Home Financials are based on the most recent Mortgage that was taken out on this home.
Original Mortgage
$496,000
Outstanding Balance
$427,072
Interest Rate
4.4%
Mortgage Type
New Conventional
Estimated Equity
$367,938
Purchase Details
Closed on
Aug 10, 2012
Sold by
Holmstrom Wesley W
Bought by
Smith Lyman and Mcmahon Kate
Home Financials for this Owner
Home Financials are based on the most recent Mortgage that was taken out on this home.
Original Mortgage
$252,000
Interest Rate
3.57%
Mortgage Type
New Conventional
Purchase Details
Closed on
Feb 14, 2006
Sold by
Cassai Mildred A
Bought by
Holmstrom Wesley W
Purchase Details
Closed on
Apr 15, 2005
Sold by
Cassai Elmer A
Bought by
Holmstrom Wesley W
Home Financials for this Owner
Home Financials are based on the most recent Mortgage that was taken out on this home.
Original Mortgage
$223,985
Interest Rate
5.89%
Mortgage Type
FHA
Create a Home Valuation Report for This Property
The Home Valuation Report is an in-depth analysis detailing your home's value as well as a comparison with similar homes in the area
Home Values in the Area
Average Home Value in this Area
Purchase History
| Date | Buyer | Sale Price | Title Company |
|---|---|---|---|
| Penman Michelle | $620,000 | Chicago Title Co | |
| Smith Lyman | $315,000 | None Available | |
| Holmstrom Wesley W | -- | Security Title | |
| Holmstrom Wesley W | $227,500 | Security Title |
Source: Public Records
Mortgage History
| Date | Status | Borrower | Loan Amount |
|---|---|---|---|
| Open | Penman Michelle | $496,000 | |
| Previous Owner | Smith Lyman | $252,000 | |
| Previous Owner | Holmstrom Wesley W | $223,985 |
Source: Public Records
Tax History Compared to Growth
Tax History
| Year | Tax Paid | Tax Assessment Tax Assessment Total Assessment is a certain percentage of the fair market value that is determined by local assessors to be the total taxable value of land and additions on the property. | Land | Improvement |
|---|---|---|---|---|
| 2024 | $4,461 | $56,320 | $38,170 | $18,150 |
| 2023 | $4,364 | $56,320 | $38,170 | $18,150 |
| 2022 | $3,529 | $44,370 | $36,900 | $7,470 |
| 2021 | $3,407 | $45,660 | $37,970 | $7,690 |
| 2020 | $3,227 | $43,500 | $31,270 | $12,230 |
| 2019 | $3,137 | $43,500 | $31,270 | $12,230 |
| 2018 | $2,594 | $33,530 | $23,080 | $10,450 |
| 2017 | $2,586 | $33,530 | $23,080 | $10,450 |
| 2016 | $2,442 | $29,950 | $16,644 | $13,306 |
| 2015 | $2,340 | $29,950 | $16,644 | $13,306 |
| 2014 | $1,874 | $22,560 | $4,975 | $17,585 |
Source: Public Records
Map
Nearby Homes
- 1815 W 39th Ave
- 1813 W 39th Ave
- 1831 W 39th Ave
- 3901 Quivas St Unit 3915
- 1837 W 39th Ave
- 3921 Quivas St
- 3921 Quivas St
- 3921 Quivas St Unit 3927
- 1816 W 39th Ave
- 3927 Quivas St
- 1824 W 39th Ave
- 1814 W 39th Ave
- 3925 Quivas St
- 1834 W 39th Ave
- 1838 W 39th Ave
- 1853 W 39th Ave
- 1802 W 39th Ave
- 3875 Quivas St
- 1844 W 39th Ave
- 3924 Shoshone St