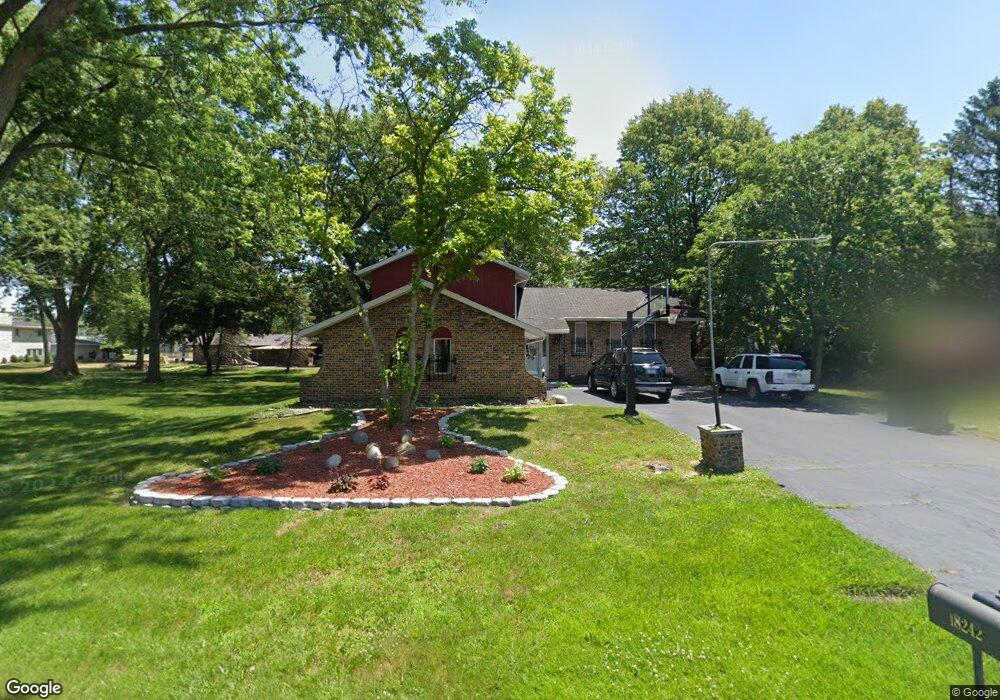
18233 Harper St Lansing, IL 60438
Estimated Value: $296,000 - $364,000
4
Beds
2
Baths
2,300
Sq Ft
$142/Sq Ft
Est. Value
About This Home
This home is located at 18233 Harper St, Lansing, IL 60438 and is currently estimated at $327,523, approximately $142 per square foot. 18233 Harper St is a home located in Cook County with nearby schools including Wolcott School, Thornwood High School, and Lansing Christian School.
Ownership History
Date
Name
Owned For
Owner Type
Purchase Details
Closed on
Feb 3, 2023
Sold by
Sosa Patricia and Briseno Abran
Bought by
Briseno Abran and Briseno Patricia
Current Estimated Value
Home Financials for this Owner
Home Financials are based on the most recent Mortgage that was taken out on this home.
Original Mortgage
$106,837
Outstanding Balance
$104,005
Interest Rate
7.25%
Mortgage Type
FHA
Estimated Equity
$223,518
Purchase Details
Closed on
Feb 1, 2017
Sold by
Leach Ronald R and Leach Sue A
Bought by
Briseno Abran and Sosa Patricia
Purchase Details
Closed on
Jun 4, 1999
Sold by
Procyk Peter and Procyk Elizabeth
Bought by
Leach Ronald R and Leach Sue A
Home Financials for this Owner
Home Financials are based on the most recent Mortgage that was taken out on this home.
Original Mortgage
$95,500
Interest Rate
7.61%
Mortgage Type
Balloon
Create a Home Valuation Report for This Property
The Home Valuation Report is an in-depth analysis detailing your home's value as well as a comparison with similar homes in the area
Home Values in the Area
Average Home Value in this Area
Purchase History
| Date | Buyer | Sale Price | Title Company |
|---|---|---|---|
| Briseno Abran | -- | None Listed On Document | |
| Briseno Abran | $170,000 | Attorney | |
| Leach Ronald R | $182,500 | Professional National Title |
Source: Public Records
Mortgage History
| Date | Status | Borrower | Loan Amount |
|---|---|---|---|
| Open | Briseno Abran | $106,837 | |
| Previous Owner | Leach Ronald R | $95,500 | |
| Closed | Leach Ronald R | $25,000 |
Source: Public Records
Tax History Compared to Growth
Tax History
| Year | Tax Paid | Tax Assessment Tax Assessment Total Assessment is a certain percentage of the fair market value that is determined by local assessors to be the total taxable value of land and additions on the property. | Land | Improvement |
|---|---|---|---|---|
| 2024 | $6,913 | $23,000 | $7,560 | $15,440 |
| 2023 | $5,116 | $23,000 | $7,560 | $15,440 |
| 2022 | $5,116 | $14,726 | $6,615 | $8,111 |
| 2021 | $4,893 | $14,726 | $6,615 | $8,111 |
| 2020 | $4,782 | $14,726 | $6,615 | $8,111 |
| 2019 | $6,349 | $15,370 | $6,142 | $9,228 |
| 2018 | $6,161 | $15,370 | $6,142 | $9,228 |
| 2017 | $4,866 | $15,370 | $6,142 | $9,228 |
| 2016 | $4,552 | $14,090 | $5,670 | $8,420 |
| 2015 | $4,263 | $14,090 | $5,670 | $8,420 |
| 2014 | $4,197 | $14,090 | $5,670 | $8,420 |
| 2013 | $4,687 | $16,603 | $5,670 | $10,933 |
Source: Public Records
Map
Nearby Homes
- 18140 Crystal Ln
- 18034 Donatus Dr
- 18049 Brittany Ln
- 18020 Charlotte Dr
- 18036 Crystal Ln
- 1614 185th St
- 18020 Ridgeland Ave
- 1890 182nd Place
- 1555 Thornton Lansing Rd
- 18038 Whitman Ln
- 17750 Clyde Ave
- 1943 182nd St
- 18443 De Jong Ln
- 18227 Olde Farm Rd
- 1991 Indiana Ave
- 18309 Bock Rd
- 18202 Locust St
- 18214 Locust St
- 18307 Locust St
- 2201 Thornton Lansing Rd
- 18249 Harper St
- 18249 Harper St
- 18249 Harper St
- 18226 Stony Island Ave
- 18215 Harper St
- 18215 Harper St
- 18215 Harper St
- 18230 Stony Island Ave
- 18230 Stony Island Ave
- 18230 Stony Island Ave
- 18230 Stony Island Ave
- 18230 Stony Island Ave
- 18242 Harper St
- 18242 Harper St
- 18242 Harper St
- 18218 Stony Island Ave
- 18218 Stony Island Ave
- 18218 Stony Island Ave
- 18218 Stony Island Ave
- 18218 Stony Island Ave