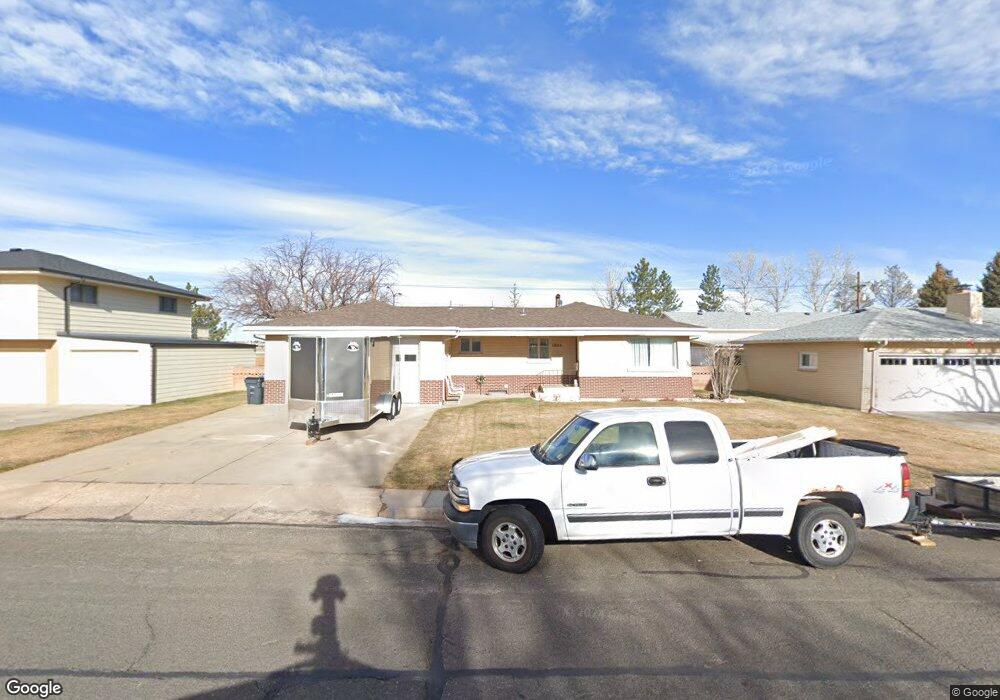
1824 Cheshire Dr Cheyenne, WY 82001
Estimated Value: $355,000 - $382,000
3
Beds
2
Baths
1,175
Sq Ft
$313/Sq Ft
Est. Value
About This Home
This home is located at 1824 Cheshire Dr, Cheyenne, WY 82001 and is currently estimated at $367,565, approximately $312 per square foot. 1824 Cheshire Dr is a home located in Laramie County with nearby schools including Henderson Elementary School, Carey Junior High School, and East High School.
Ownership History
Date
Name
Owned For
Owner Type
Purchase Details
Closed on
Nov 30, 2011
Sold by
Neeley Phyllis L
Bought by
Rothwell Robert A and Rothwell Pamela J
Current Estimated Value
Home Financials for this Owner
Home Financials are based on the most recent Mortgage that was taken out on this home.
Original Mortgage
$128,000
Outstanding Balance
$88,064
Interest Rate
4.13%
Mortgage Type
New Conventional
Estimated Equity
$279,501
Purchase Details
Closed on
Nov 7, 2003
Sold by
Cheever Janice A
Bought by
Neeley Phyllis L
Home Financials for this Owner
Home Financials are based on the most recent Mortgage that was taken out on this home.
Original Mortgage
$127,920
Interest Rate
3.62%
Mortgage Type
Purchase Money Mortgage
Purchase Details
Closed on
Dec 31, 1999
Sold by
James Dorothy Ann and James Dorothy A
Bought by
James Dorothy A and Dorothy A James Revocable Trus
Create a Home Valuation Report for This Property
The Home Valuation Report is an in-depth analysis detailing your home's value as well as a comparison with similar homes in the area
Home Values in the Area
Average Home Value in this Area
Purchase History
| Date | Buyer | Sale Price | Title Company |
|---|---|---|---|
| Rothwell Robert A | -- | None Available | |
| Neeley Phyllis L | -- | -- | |
| James Dorothy A | -- | -- |
Source: Public Records
Mortgage History
| Date | Status | Borrower | Loan Amount |
|---|---|---|---|
| Open | Rothwell Robert A | $128,000 | |
| Previous Owner | Neeley Phyllis L | $127,920 |
Source: Public Records
Tax History Compared to Growth
Tax History
| Year | Tax Paid | Tax Assessment Tax Assessment Total Assessment is a certain percentage of the fair market value that is determined by local assessors to be the total taxable value of land and additions on the property. | Land | Improvement |
|---|---|---|---|---|
| 2025 | $2,211 | $23,983 | $3,600 | $20,383 |
| 2024 | $2,211 | $31,267 | $4,800 | $26,467 |
| 2023 | $2,139 | $30,251 | $4,800 | $25,451 |
| 2022 | $2,073 | $28,715 | $4,800 | $23,915 |
| 2021 | $1,793 | $24,790 | $4,800 | $19,990 |
| 2020 | $1,874 | $25,978 | $4,800 | $21,178 |
| 2019 | $1,802 | $24,955 | $4,800 | $20,155 |
| 2018 | $1,613 | $22,559 | $4,415 | $18,144 |
| 2017 | $1,586 | $21,980 | $4,415 | $17,565 |
| 2016 | $1,495 | $20,710 | $4,174 | $16,536 |
| 2015 | $1,387 | $19,208 | $4,174 | $15,034 |
| 2014 | $1,326 | $18,235 | $4,174 | $14,061 |
Source: Public Records
Map
Nearby Homes
- 3700 Essex Rd
- 1801 Milton Dr
- 1813 Andover Dr
- 1702 Newton Dr
- 1813 Newton Dr
- 3444 Dover Rd
- 3561 Boston Rd
- 1958 Newton Dr
- 3628 Amherst Rd
- 1751 E Pershing Blvd
- 1731 E Pershing Blvd
- 2004 E 22nd St
- 1793 Spring Ct
- 1808 E 21st St
- 1610 E 20th St
- 3333 Duff Ave
- TBD Charles St
- TBD E Lincolnway
- Lot 1 E Phipps Ave
- Tract 1 E Pershing Blvd
- 1830 Cheshire Dr
- 1818 Cheshire Dr
- 1838 Cheshire Dr
- 1810 Cheshire Dr
- 1829 Cheshire Dr
- 1823 Cheshire Dr
- 1804 Cheshire Dr
- 1835 Cheshire Dr
- 1809 Cheshire Dr
- 1843 Cheshire Dr
- 1854 Cheshire Dr
- 1770 Cheshire Dr
- 1851 Cheshire Dr
- 3741 Dover Rd
- 1764 Cheshire Dr
- 1860 Cheshire Dr
- 3733 Dover Rd
- 1859 Cheshire Dr
- 1732 Milton Dr
- 1803 Cheshire Dr