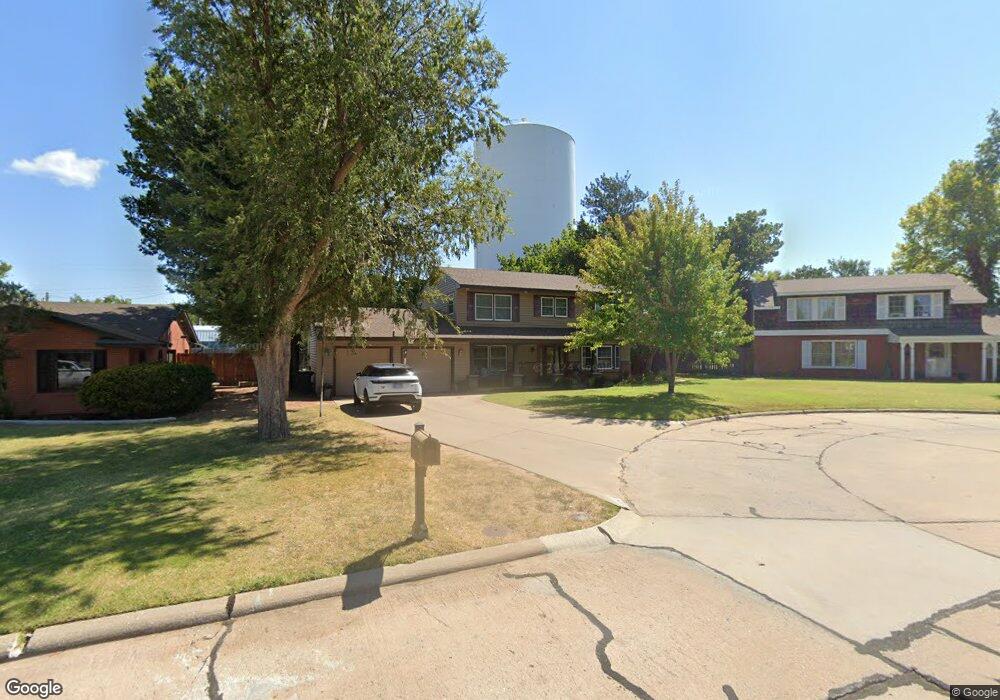
1824 Hillcrest Dr Woodward, OK 73801
Estimated Value: $165,000 - $266,000
4
Beds
3
Baths
2,090
Sq Ft
$107/Sq Ft
Est. Value
About This Home
This home is located at 1824 Hillcrest Dr, Woodward, OK 73801 and is currently estimated at $222,667, approximately $106 per square foot. 1824 Hillcrest Dr is a home located in Woodward County with nearby schools including Woodward High School and Woodward Christian Academy.
Ownership History
Date
Name
Owned For
Owner Type
Purchase Details
Closed on
Dec 13, 2017
Sold by
Miller Brandon and Miller Ahley
Bought by
Blackard Lucas C
Current Estimated Value
Home Financials for this Owner
Home Financials are based on the most recent Mortgage that was taken out on this home.
Original Mortgage
$242,526
Outstanding Balance
$206,562
Interest Rate
4.4%
Mortgage Type
FHA
Estimated Equity
$16,105
Purchase Details
Closed on
Nov 10, 2014
Sold by
Murphy Mark E and Murphy Donna S
Bought by
Miller Brandon and Miller Ashley
Home Financials for this Owner
Home Financials are based on the most recent Mortgage that was taken out on this home.
Original Mortgage
$225,000
Interest Rate
4.21%
Mortgage Type
Unknown
Purchase Details
Closed on
Feb 26, 1996
Bought by
Murphy Mark E
Purchase Details
Closed on
Dec 15, 1992
Bought by
Whetstone Monty L
Create a Home Valuation Report for This Property
The Home Valuation Report is an in-depth analysis detailing your home's value as well as a comparison with similar homes in the area
Home Values in the Area
Average Home Value in this Area
Purchase History
| Date | Buyer | Sale Price | Title Company |
|---|---|---|---|
| Blackard Lucas C | $247,000 | None Available | |
| Miller Brandon | $125,000 | None Available | |
| Murphy Mark E | $107,500 | -- | |
| Whetstone Monty L | $112,700 | -- |
Source: Public Records
Mortgage History
| Date | Status | Borrower | Loan Amount |
|---|---|---|---|
| Open | Blackard Lucas C | $242,526 | |
| Previous Owner | Miller Brandon | $225,000 |
Source: Public Records
Tax History Compared to Growth
Tax History
| Year | Tax Paid | Tax Assessment Tax Assessment Total Assessment is a certain percentage of the fair market value that is determined by local assessors to be the total taxable value of land and additions on the property. | Land | Improvement |
|---|---|---|---|---|
| 2023 | $2,259 | $24,759 | $2,375 | $22,384 |
| 2022 | $2,344 | $25,244 | $2,375 | $22,869 |
| 2021 | $2,282 | $25,244 | $2,375 | $22,869 |
| 2020 | $2,299 | $25,244 | $2,375 | $22,869 |
| 2019 | $2,403 | $26,916 | $2,375 | $24,541 |
| 2018 | $2,465 | $27,170 | $2,375 | $24,795 |
| 2017 | $1,758 | $19,594 | $2,375 | $17,219 |
| 2016 | $2,283 | $25,094 | $2,375 | $22,719 |
| 2015 | $2,194 | $25,094 | $2,375 | $22,719 |
| 2014 | $1,128 | $12,907 | $1,163 | $11,744 |
Source: Public Records
Map
Nearby Homes
- 1816 Hillcrest Dr
- 1828 Hillcrest Dr
- 1810 Hillcrest Dr
- 1823 15th St
- 1823 Hillcrest Dr
- 1524 Cedar Ave
- 1831 Hillcrest Dr
- 1512 Cedar Ave
- 1817 Hillcrest Dr
- 1604 Cedar Ave
- 1804 Hillcrest Dr
- 1506 Cedar Ave
- 1505 Walnut St
- 1807 Hillcrest Dr
- 1612 Cedar Ave
- 1801 Hillcrest Dr
- 1423 Elm St
- 1423 Elm Ave
- 1908 Broadmoor Dr
- 1904 Broadmoor Dr