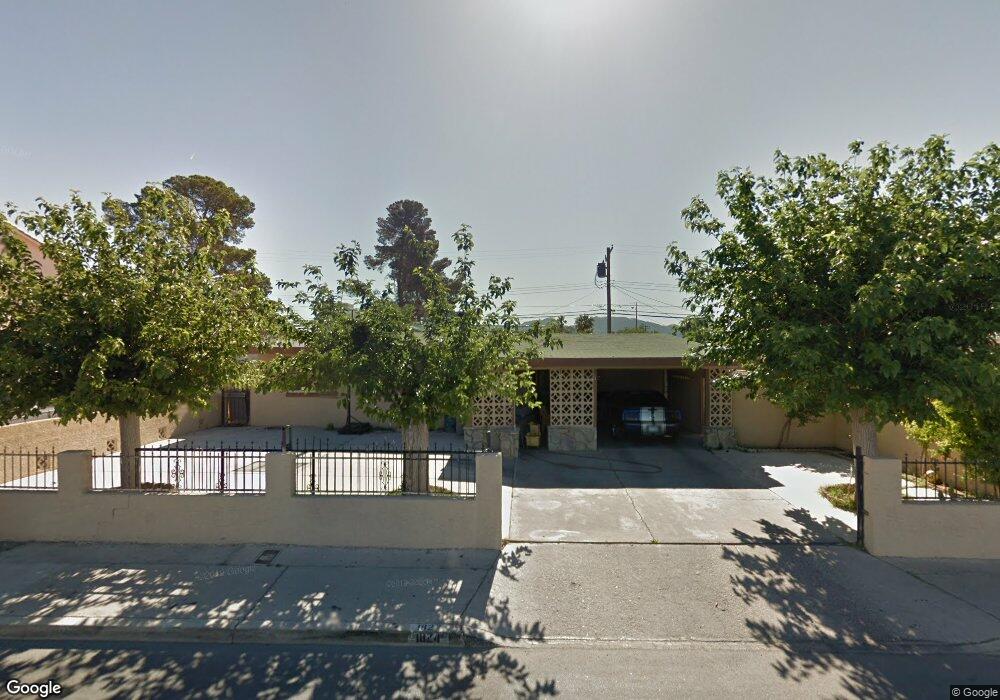
1824 Mccarran St North Las Vegas, NV 89030
Downtown North Las Vegas NeighborhoodEstimated Value: $265,724 - $299,000
3
Beds
1
Bath
1,205
Sq Ft
$235/Sq Ft
Est. Value
About This Home
This home is located at 1824 Mccarran St, North Las Vegas, NV 89030 and is currently estimated at $283,681, approximately $235 per square foot. 1824 Mccarran St is a home located in Clark County with nearby schools including Tom Williams Elementary School, J.D. Smith Middle School, and Rancho High School.
Ownership History
Date
Name
Owned For
Owner Type
Purchase Details
Closed on
May 14, 2019
Sold by
Vasquez Maria J
Bought by
Mj Vasquez Trust
Current Estimated Value
Purchase Details
Closed on
Sep 12, 2016
Sold by
Vasquez Maria J and Zapien Maria J
Bought by
Vasquez Maria J
Purchase Details
Closed on
Feb 2, 2007
Sold by
Zapien Andres G and Zapien Maria J
Bought by
Zapien Maria J
Purchase Details
Closed on
Nov 8, 2001
Sold by
Zapien Maria J
Bought by
Zapien Maria J
Home Financials for this Owner
Home Financials are based on the most recent Mortgage that was taken out on this home.
Original Mortgage
$62,000
Interest Rate
6.62%
Purchase Details
Closed on
Dec 28, 1995
Sold by
Zapien Maria J
Bought by
Zapien Maria J
Home Financials for this Owner
Home Financials are based on the most recent Mortgage that was taken out on this home.
Original Mortgage
$44,100
Interest Rate
7.37%
Create a Home Valuation Report for This Property
The Home Valuation Report is an in-depth analysis detailing your home's value as well as a comparison with similar homes in the area
Home Values in the Area
Average Home Value in this Area
Purchase History
| Date | Buyer | Sale Price | Title Company |
|---|---|---|---|
| Mj Vasquez Trust | -- | None Available | |
| Vasquez Maria J | -- | None Available | |
| Zapien Maria J | $210,000 | None Available | |
| Zapien Maria J | -- | Nevada Title Company | |
| Zapien Maria J | -- | Fidelity National Title |
Source: Public Records
Mortgage History
| Date | Status | Borrower | Loan Amount |
|---|---|---|---|
| Previous Owner | Zapien Maria J | $62,000 | |
| Previous Owner | Zapien Maria J | $44,100 |
Source: Public Records
Tax History Compared to Growth
Tax History
| Year | Tax Paid | Tax Assessment Tax Assessment Total Assessment is a certain percentage of the fair market value that is determined by local assessors to be the total taxable value of land and additions on the property. | Land | Improvement |
|---|---|---|---|---|
| 2025 | $622 | $40,685 | $24,150 | $16,535 |
| 2024 | $604 | $40,685 | $24,150 | $16,535 |
| 2023 | $604 | $40,812 | $25,900 | $14,912 |
| 2022 | $643 | $35,118 | $21,700 | $13,418 |
| 2021 | $596 | $32,747 | $20,300 | $12,447 |
| 2020 | $550 | $31,369 | $19,250 | $12,119 |
| 2019 | $516 | $27,418 | $15,750 | $11,668 |
| 2018 | $492 | $23,551 | $12,600 | $10,951 |
| 2017 | $716 | $21,351 | $10,500 | $10,851 |
| 2016 | $462 | $17,542 | $7,000 | $10,542 |
| 2015 | $460 | $15,823 | $5,600 | $10,223 |
| 2014 | $445 | $13,510 | $4,200 | $9,310 |
Source: Public Records
Map
Nearby Homes
- 1311 Flower Ave
- 1904 Gifford St
- 2801 Emmons Ave
- 2613 Hickey Ave
- 2844 Hickey Ave
- 2315 Perliter Ave
- 0 E Reynolds Ave
- 2746 E Owens Ave
- 2214 Daley St
- 2232 Bassler St
- 3308 E Lake Mead Blvd
- 3104 Dillon Ave
- 2105 Stanley Ave
- 3308 Tabor Ave
- 3200 E Owens Ave
- 2252 Ellis St
- 1628 Palmer St
- 3024 Orr Ave
- 1413 N Mojave Rd
- 1615 Flower Ave
- 1828 Mccarran St
- 1837 Bassler St
- 1829 Bassler St Unit 3
- 1832 Mccarran St
- 1816 Mccarran St
- 2712 Flower Ave
- 2633 Flower Ave
- 2632 Flower Ave
- 1825 Bassler St
- 1836 Mccarran St
- 1812 Mccarran St
- 2707 Hickey Ave
- 2629 Flower Ave
- 2628 Flower Ave
- 2716 Flower Ave Unit 3
- 2632 Perliter Ave
- 2633 Hickey Ave
- 2711 Hickey Ave
- 2721 Flower Ave