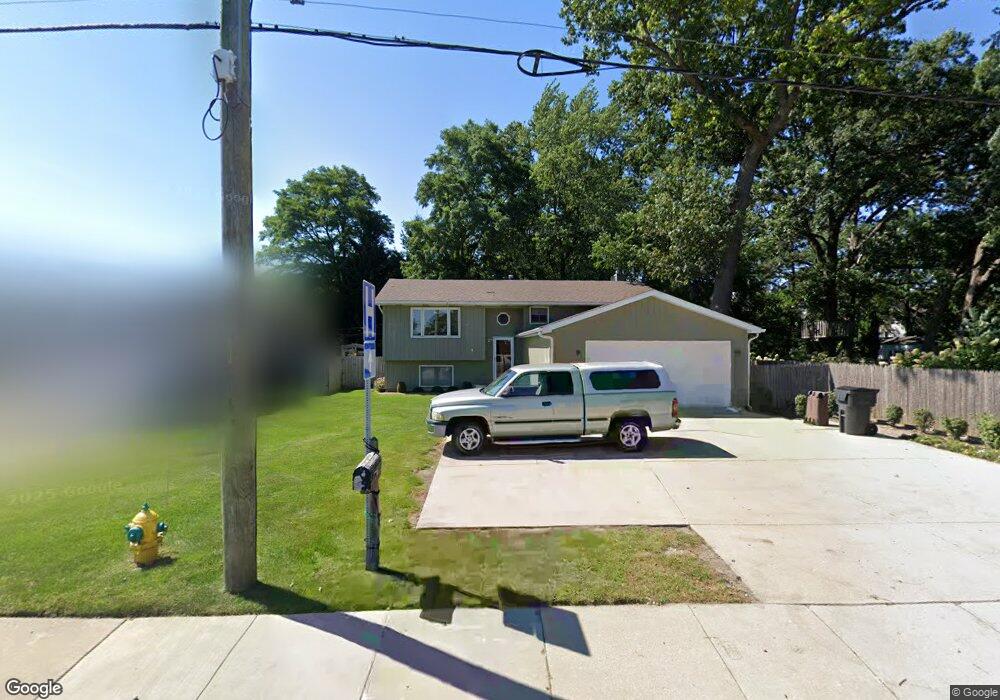
1824 N Sheridan Rd Waukegan, IL 60087
Greenwood Park NeighborhoodEstimated Value: $277,000 - $311,679
4
Beds
2
Baths
1,242
Sq Ft
$231/Sq Ft
Est. Value
About This Home
This home is located at 1824 N Sheridan Rd, Waukegan, IL 60087 and is currently estimated at $286,670, approximately $230 per square foot. 1824 N Sheridan Rd is a home located in Lake County with nearby schools including Greenwood Elementary School, Edith M Smith Middle School, and Waukegan High School.
Ownership History
Date
Name
Owned For
Owner Type
Purchase Details
Closed on
Jul 15, 2024
Sold by
Kathryn M Fitzgerald Trust and Fitzgerald Kathryn M
Bought by
French Jordan
Current Estimated Value
Home Financials for this Owner
Home Financials are based on the most recent Mortgage that was taken out on this home.
Original Mortgage
$237,500
Outstanding Balance
$234,712
Interest Rate
7.08%
Mortgage Type
New Conventional
Estimated Equity
$51,958
Purchase Details
Closed on
Dec 21, 1998
Sold by
Fitzgerald Kathryn M
Bought by
Fitzgerald Kathryn M and Kathryn M Fitzgerald Trust
Purchase Details
Closed on
Feb 25, 1994
Sold by
Drobnick Jeffrey A
Bought by
Fitzgerald Kathryn M
Home Financials for this Owner
Home Financials are based on the most recent Mortgage that was taken out on this home.
Original Mortgage
$116,800
Interest Rate
7.1%
Create a Home Valuation Report for This Property
The Home Valuation Report is an in-depth analysis detailing your home's value as well as a comparison with similar homes in the area
Home Values in the Area
Average Home Value in this Area
Purchase History
| Date | Buyer | Sale Price | Title Company |
|---|---|---|---|
| French Jordan | $250,000 | First American Title | |
| Fitzgerald Kathryn M | -- | -- | |
| Fitzgerald Kathryn M | $97,333 | Chicago Title Insurance Co |
Source: Public Records
Mortgage History
| Date | Status | Borrower | Loan Amount |
|---|---|---|---|
| Open | French Jordan | $237,500 | |
| Previous Owner | Fitzgerald Kathryn M | $116,800 |
Source: Public Records
Tax History Compared to Growth
Tax History
| Year | Tax Paid | Tax Assessment Tax Assessment Total Assessment is a certain percentage of the fair market value that is determined by local assessors to be the total taxable value of land and additions on the property. | Land | Improvement |
|---|---|---|---|---|
| 2024 | $7,404 | $95,877 | $14,373 | $81,504 |
| 2023 | $7,567 | $86,515 | $12,969 | $73,546 |
| 2022 | $7,567 | $83,400 | $10,102 | $73,298 |
| 2021 | $7,555 | $78,463 | $9,011 | $69,452 |
| 2020 | $7,606 | $73,098 | $8,395 | $64,703 |
| 2019 | $7,602 | $66,983 | $7,693 | $59,290 |
| 2018 | $6,399 | $55,878 | $10,888 | $44,990 |
| 2017 | $6,225 | $49,437 | $9,633 | $39,804 |
| 2016 | $5,711 | $42,959 | $8,371 | $34,588 |
| 2015 | $5,481 | $38,449 | $7,492 | $30,957 |
| 2014 | $5,613 | $38,712 | $7,923 | $30,789 |
| 2012 | $7,176 | $41,941 | $8,584 | $33,357 |
Source: Public Records
Map
Nearby Homes
- 616 W Keith Ave
- 1905 Linden Ave
- 1336 N Ash St
- 1335 Chestnut St
- 1018 W Atlantic Ave
- 2213 Alta Vista Dr
- 2246 Alta Vista Dr
- 2232 Walnut St
- 1110 N Ash St
- 1312 N Linden Ave
- 301 W Eagle Ct
- 415 W Ridgeland Ave
- 0 Traditions Dr
- 1105 Woodlawn Cir
- 918 N Ash St
- 1504 W Glen Flora Ave
- 917 N Linden Ave
- 723 N County St
- 1000 Pine St
- 1117 Judge Ave
- 1828 N Sheridan Rd
- 1818 N Sheridan Rd
- 324 Glendenning Place
- 328 Glendenning Place
- 316 Glendenning Place
- 330 Glendenning Place
- 1812 N Sheridan Rd
- 308 Glendenning Place
- 1848 N Sheridan Rd
- 312 W Greenwood Ave
- 310 W Greenwood Ave
- 308 W Greenwood Ave
- 340 Glendenning Place
- 306 W Greenwood Ave
- 304 Glendenning Place
- 344 Glendenning Place
- 323 Glendenning Place
- 333 Glendenning Place
- 317 Glendenning Place