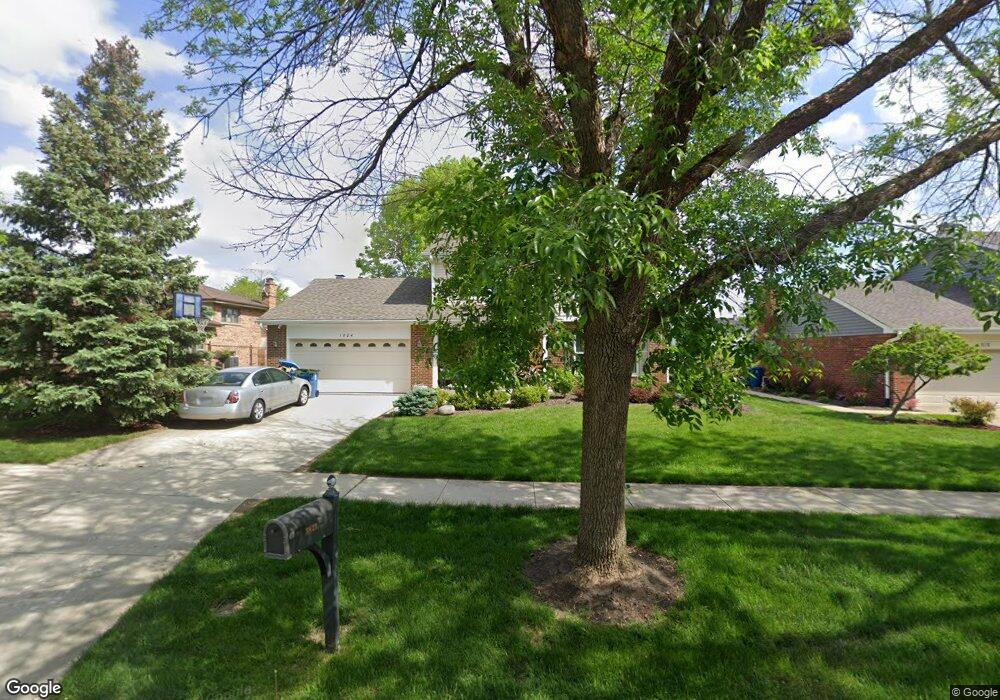
1824 Newport Rd Downers Grove, IL 60516
South Downers Grove NeighborhoodEstimated Value: $500,000 - $547,463
4
Beds
3
Baths
1,878
Sq Ft
$282/Sq Ft
Est. Value
About This Home
This home is located at 1824 Newport Rd, Downers Grove, IL 60516 and is currently estimated at $529,116, approximately $281 per square foot. 1824 Newport Rd is a home located in DuPage County with nearby schools including Indian Trail Elementary School, O'Neill Middle School, and Downers Grove South High School.
Ownership History
Date
Name
Owned For
Owner Type
Purchase Details
Closed on
Jan 8, 2010
Sold by
Harkawat Bohara Vinay and Harkawat Jheel
Bought by
Diestler Alexander J and Diestler Amy L
Current Estimated Value
Home Financials for this Owner
Home Financials are based on the most recent Mortgage that was taken out on this home.
Original Mortgage
$242,250
Interest Rate
5.3%
Mortgage Type
New Conventional
Purchase Details
Closed on
Aug 26, 2002
Sold by
Mangalesseril Thomas C and Thomas Sherly M
Bought by
Harkawat Bohara Vinay and Harkawat Jheel
Home Financials for this Owner
Home Financials are based on the most recent Mortgage that was taken out on this home.
Original Mortgage
$212,800
Interest Rate
6.41%
Purchase Details
Closed on
Aug 22, 1995
Sold by
Schupp George C and Schupp Elizabeth A
Bought by
Mangalesseril Thomas C and Thomas Sheryl M
Home Financials for this Owner
Home Financials are based on the most recent Mortgage that was taken out on this home.
Original Mortgage
$142,400
Interest Rate
7.55%
Create a Home Valuation Report for This Property
The Home Valuation Report is an in-depth analysis detailing your home's value as well as a comparison with similar homes in the area
Home Values in the Area
Average Home Value in this Area
Purchase History
| Date | Buyer | Sale Price | Title Company |
|---|---|---|---|
| Diestler Alexander J | $285,000 | Bt | |
| Harkawat Bohara Vinay | $266,000 | Stewart Title Company | |
| Mangalesseril Thomas C | $178,000 | Attorneys Title Guaranty Fun |
Source: Public Records
Mortgage History
| Date | Status | Borrower | Loan Amount |
|---|---|---|---|
| Previous Owner | Diestler Alexander J | $242,250 | |
| Previous Owner | Harkawat Bohara Vinay | $212,800 | |
| Previous Owner | Mangalesseril Thomas C | $142,400 |
Source: Public Records
Tax History Compared to Growth
Tax History
| Year | Tax Paid | Tax Assessment Tax Assessment Total Assessment is a certain percentage of the fair market value that is determined by local assessors to be the total taxable value of land and additions on the property. | Land | Improvement |
|---|---|---|---|---|
| 2024 | $8,154 | $150,421 | $54,249 | $96,172 |
| 2023 | $7,744 | $138,280 | $49,870 | $88,410 |
| 2022 | $7,301 | $130,060 | $47,670 | $82,390 |
| 2021 | $6,833 | $128,580 | $47,130 | $81,450 |
| 2020 | $6,706 | $126,040 | $46,200 | $79,840 |
| 2019 | $6,491 | $120,940 | $44,330 | $76,610 |
| 2018 | $6,430 | $118,500 | $44,010 | $74,490 |
| 2017 | $6,224 | $114,030 | $42,350 | $71,680 |
| 2016 | $6,098 | $108,830 | $40,420 | $68,410 |
| 2015 | $6,029 | $102,390 | $38,030 | $64,360 |
| 2014 | $6,031 | $99,560 | $36,980 | $62,580 |
| 2013 | $5,859 | $98,320 | $36,810 | $61,510 |
Source: Public Records
Map
Nearby Homes
- 7020 Sussex Ct Unit 203
- 7050 Brighton Ct Unit 204
- 7000 Sussex Ct Unit 204
- 6803 Penner Place
- 1906 Concord Dr
- 6819 Prairieview Ave
- 7020 Andover Ct Unit 102
- 2032 Wheeler St
- Lot 006 Woodward Ave
- 7123 Dunham Rd
- 7127 Dunham Rd
- 6831 Dove Ave Unit 9
- 14 Kildeer Ct
- 2486 Brunswick Cir Unit A2
- 6820 Barrett St
- 6651 Dunham Rd
- 1909 Bates Place
- 7205 Kidwell Rd
- 1974 Loomes Ave
- 18 Woodsorrel Place
- 1818 Newport Rd
- 1830 Newport Rd
- 1825 Essex Place
- 1831 Essex Place
- 1836 Newport Rd
- 1812 Newport Rd
- 1819 Essex Place
- 1825 Newport Rd
- 1831 Newport Rd
- 1806 Newport Rd
- 1837 Essex Place
- 1813 Essex Place Unit 4
- 1819 Newport Rd
- 1837 Newport Rd
- 1813 Newport Rd
- 1843 Newport Rd
- 7019 Cambridge Rd
- 7013 Cambridge Rd
- 1807 Essex Place
- 1800 Newport Rd