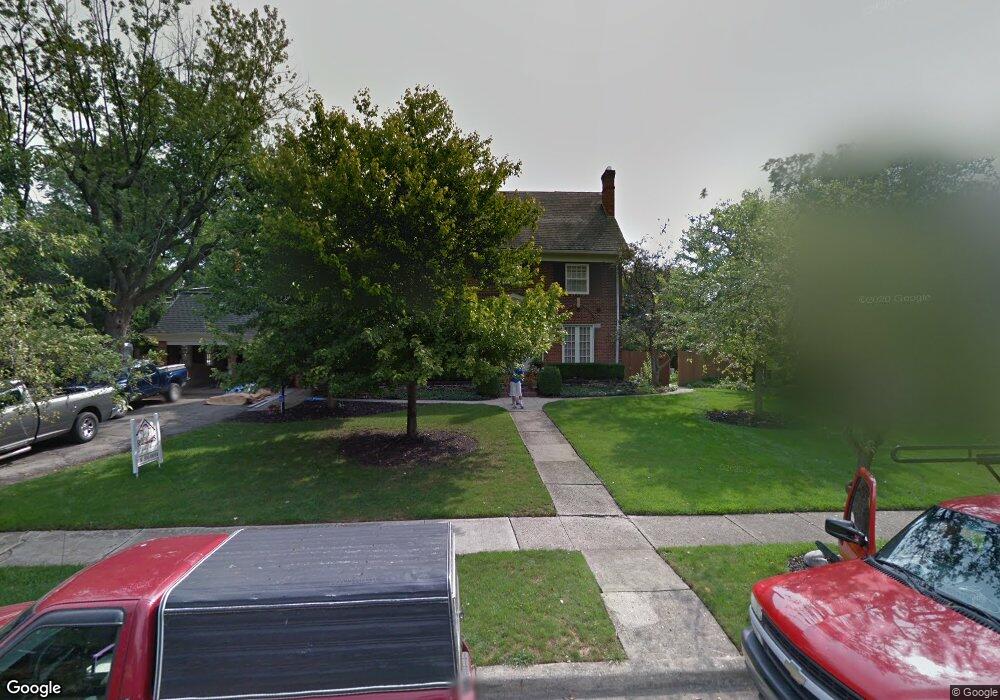
1824 Roxbury Rd Columbus, OH 43212
Estimated Value: $1,719,721 - $2,245,000
6
Beds
4
Baths
4,196
Sq Ft
$485/Sq Ft
Est. Value
About This Home
This home is located at 1824 Roxbury Rd, Columbus, OH 43212 and is currently estimated at $2,033,180, approximately $484 per square foot. 1824 Roxbury Rd is a home located in Franklin County with nearby schools including Barrington Road Elementary School, Jones Middle School, and Upper Arlington High School.
Ownership History
Date
Name
Owned For
Owner Type
Purchase Details
Closed on
Aug 28, 2025
Sold by
Shanklin Thomas Anthony and Shanklin Melissa Komosa
Bought by
Sandisfield Skyledge Revocable Trust and Shanklin
Current Estimated Value
Purchase Details
Closed on
Jun 22, 2009
Sold by
Allen John Geoffrey and Chung Carol Yong
Bought by
Shanklin Thomas A and Shanklin Melissa K
Purchase Details
Closed on
May 16, 1995
Sold by
Foster Louesa C
Bought by
John Timothy Yount Trst
Home Financials for this Owner
Home Financials are based on the most recent Mortgage that was taken out on this home.
Original Mortgage
$50,000
Interest Rate
8.39%
Mortgage Type
New Conventional
Purchase Details
Closed on
Mar 30, 1993
Create a Home Valuation Report for This Property
The Home Valuation Report is an in-depth analysis detailing your home's value as well as a comparison with similar homes in the area
Home Values in the Area
Average Home Value in this Area
Purchase History
| Date | Buyer | Sale Price | Title Company |
|---|---|---|---|
| Sandisfield Skyledge Revocable Trust | -- | None Listed On Document | |
| Shanklin Thomas A | $825,000 | Title First | |
| John Timothy Yount Trst | $655,000 | -- | |
| -- | -- | -- |
Source: Public Records
Mortgage History
| Date | Status | Borrower | Loan Amount |
|---|---|---|---|
| Previous Owner | John Timothy Yount Trst | $50,000 |
Source: Public Records
Tax History Compared to Growth
Tax History
| Year | Tax Paid | Tax Assessment Tax Assessment Total Assessment is a certain percentage of the fair market value that is determined by local assessors to be the total taxable value of land and additions on the property. | Land | Improvement |
|---|---|---|---|---|
| 2024 | $27,885 | $481,670 | $140,280 | $341,390 |
| 2023 | $27,540 | $481,670 | $140,280 | $341,390 |
| 2022 | $26,485 | $379,020 | $89,110 | $289,910 |
| 2021 | $23,445 | $379,020 | $89,110 | $289,910 |
| 2020 | $23,237 | $379,020 | $89,110 | $289,910 |
| 2019 | $22,833 | $329,280 | $89,110 | $240,170 |
| 2018 | $21,509 | $329,280 | $89,110 | $240,170 |
| 2017 | $22,536 | $329,280 | $89,110 | $240,170 |
| 2016 | $22,415 | $339,010 | $108,080 | $230,930 |
| 2015 | $20,314 | $307,510 | $108,080 | $199,430 |
| 2014 | $20,337 | $307,510 | $108,080 | $199,430 |
| 2013 | $9,711 | $279,545 | $98,245 | $181,300 |
Source: Public Records
Map
Nearby Homes
- 2015 W 5th Ave Unit 211
- 2015 W 5th Ave Unit 102
- 2015 W 5th Ave Unit 108
- 1631 Roxbury Rd Unit F3
- 1631 Roxbury Rd Unit B6
- 1782 Wyandotte Rd
- 1561 Glenn Ave
- 1733 Elmwood Ave
- 1661 Ashland Ave Unit 663
- 2110 Northwest Blvd
- 1914 Elmwood Ave
- 1459 Elmwood Ave Unit 1459
- 1869 Tewksbury Rd
- 2063 Westover Rd
- 1313 Lincoln Rd
- 1398 Lower Green Cir Unit 1398
- 1301 Lake Shore Dr Unit 199
- 1535 Doone Rd
- 1565 Berkshire Rd
- 2700 Mc Kinley Ave
- 1814 Roxbury Rd
- 1835 Cambridge Blvd
- 1861 Cambridge Blvd
- 1827 Cambridge Blvd
- 1804 Roxbury Rd
- 1823 Cambridge Blvd
- 1831 Roxbury Rd
- 1819 Roxbury Rd
- 1811 Roxbury Rd
- 1841 Roxbury Rd
- 1794 Roxbury Rd
- 2010 W Devon Rd
- 2010 N Devon Rd
- 2000 W Devon Rd
- 1811 Arlington Ave
- 1811 Cambridge Blvd
- 1801 Roxbury Rd
- 1847 Arlington Ave
- 1860 Cambridge Blvd
- 2061 Stanford Rd